Every time you surf the web, a whole bunch of technical stuff happens behind the scenes to deliver content to your screen.
Engineers are usually the ones managing these activities. Marketers, even those with technical chops, tend to shy away from it. One of these activities is an HTTP request, and it's actually not as complicated as you might think. In fact, marketers need to have at least a general understanding of the actions their own website performs each time a person visits it.
The metrics marketers tend to be responsible for can depend heavily on how the backend of a website is developed. For example, a high number of HTTP requests by your webpage can slow down the page's load time, which ultimately damages the user experience. This can cause your visitors to leave the page more quickly if it doesn't load fast enough (which increases your
"bounce rate").
HTTP requests can affect numerous key metrics that determine how engaged your audience is with your business.
So, what exactly is an HTTP request? How does it affect the user experience? And what can a marketer do to reduce their website's HTTP requests? Let's go through each of these questions one by one. By the end, you'll have a better grasp on why these response protocols matter, and what you can do to give your website visitors a better, faster experience.
What are HTTP Requests?
HTTP requests happen when a web browser sends a "request" to your website's server for information on a webpage. When a user visits a page on your website, your server heeds this request and returns the files contained on that page to the user's browser. The fewer HTTP requests a website has to make, the faster the site can load.
Each time someone visits a page on your website, here's what typically happens:
- The person's web browser (popular browsers include Chrome, Firefox, and Safari) sends a request to your web server. Your server hosts the webpage they're trying to visit on your site.
- The browser requests that your server send over a file containing content associated with that page. This file may contain text, images, or multimedia that exist on your webpage.
- Once the person's browser receives this file, it begins to render your website on the person's computer screen or mobile device.
- If there is more content on your webpage the browser has not yet received, the browser will send another HTTP request.
The above steps describe a single HTTP request, from ask to answer. HTTP stands for "Hypertext Transfer Protocol," which is just a fancy name for a web browser sending a request for a file, and the server sending (or "transferring") that file to the browser.
Why HTTP Requests Affect the User Experience
There are two reasons HTTP requests can affect your website's user experience: the number of files being requested and the size of the files being transferred.
More Files = More HTTP Requests
A web browser needs to make a separate HTTP request for every single file on your website. If your website doesn't have many files, it won't take very long to request and download the content on your site. But most good websites do have a lot of files.
The more files on your website, the more HTTP requests your user's browser will need to make. The more HTTP requests a browser makes, the longer your site takes to load.
Bigger Files = Longer HTTP Requests
The size of the file being transferred is also a factor in how long a page may take to load on a user's screen. And just as the files on your computer have various file sizes -- measured in bytes (B), kilobytes (KB), megabytes (MB), and so on -- so too do the files embedded on your webpage. Big, high-definition images are a common culprit of large file sizes.
In other words, the larger or higher definition the content is on your website, the larger its file size is. The larger the file size, the longer it will take to transfer it from your server to a user's browser.
The longer this file is it transit, the longer a user's browser has to wait before it renders this content on his/her screen.
How HTTP Requests Affect the User Experience
A long load time can be a disruptive and frustrating experience for your users. Mobile users will have a particularly bad experience, as most of them will have to wait until every asset on a webpage is downloaded before the page even begins to appear in their mobile browser.
And research shows load time matters when it comes to website performance. According to data from Pingdom, a website performance monitor, a page's bounce rate can soar from 9% to a whopping 38% if its page load time increases from just 2 seconds to 5 seconds. This is because lots more people "bounce" from your website during that three-second delay.
So, what's the magic number of HTTP requests a website should aim for? The answer is not "one." Some people think they can solve the problem by only using one JavaScript file to control their entire website. But remember: File size affects load time, too. For complex websites, that one file can be an incredibly long trip from your server to your audience's browser.
Although there isn't necessarily an optimal number of files your webpage should be reduced to, HubSpot's principal product marketing manager Jeffrey Vocell suggests aiming for between 10–30 files.
For most top-performing websites, getting there is difficult and generally requires dedicated engineering resources. As of March 2019, the median number of HTTP page requests to load a webpage on mobile or desktop was between 69 and 75 requests.
How to Make Fewer HTTP Requests to Your Website
1. Grade your website's performance to find the root problem.
If you're starting from scratch, with no idea how your website is performing, you'll first want a detailed report of your website's overall health. To get this report, check out HubSpot's Website Grader.
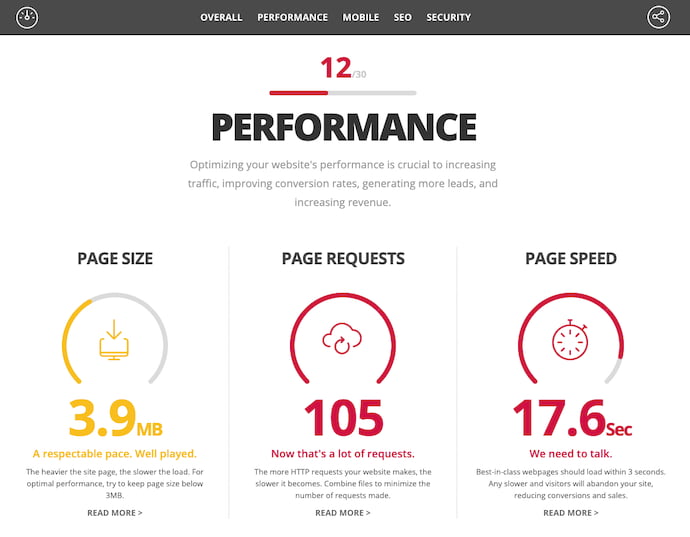
Using Website Grader, simply enter your email address and the URL of the webpage you want to audit. You'll receive a free, personalized report that grades your site on key metrics including mobile readiness, SEO, your page's total file size, and of course, how many HTTP requests the page is receiving.
This grader can help you diagnose the precise issue you suspect your website is having. For example, if you have a low number of page requests, but a high page size, your goal should be to reduce the size of the media on your website -- not necessarily to reduce the amount of HTTP requests you're requiring browsers to make.
2. Check how many HTTP requests your site currently makes.
Once you have an idea of how "big" your webpage is, and how many page requests it's requiring, use Google Chrome's Network panel to drill down into these numbers. This tool makes it easy for anyone to check what's on your page, how many HTTP requests the page makes, and what file is taking the longest to load.
To Find a Request's Length ...
First, this tool shows you all the files a browser had to request and transfer in order to download the page -- and it also shows a timeline of when this happened. For example, Google Chrome's API can tell you precisely when the HTTP request for an image started, and when the image's final byte was received. It's a really helpful way of seeing what's on your page and what's taking a long time to load.
To see the Network panel for a given webpage, open the webpage in Google Chrome. In the main Chrome menu at the top of your screen, go to View > Developer > Developer Tools.
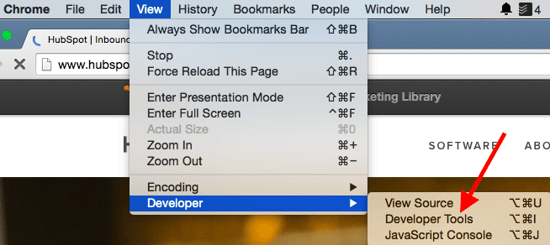
The Network panel will open in your browser. Since it records all network activity while DevTools is open, the panel may be empty when you first open it. Reload the page to start recording, or just wait for network activity to occur in your application.
Here's an overview of what everything in the Network panel means:
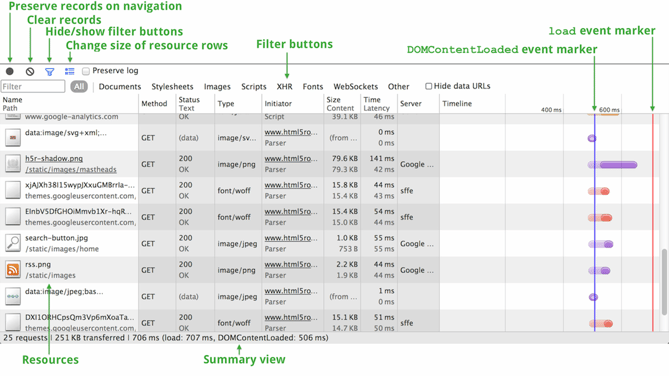
Image Credit: Google
To Count HTTP Requests ...
Curious how many requests your website requires? The Network panel will tell you that, too. Take a look at the very bottom left of the screenshot above and you'll see the total number of requests; in this case, it's 25 requests.
To learn how to read the panel and evaluate your network performance in more detail, read through this Google Chrome resource.
3. Remove unnecessary images.
At this point, you should have an idea of which files are taking longest to load, including image files. The easiest way to reduce the number of requested files? Eliminate unnecessary images.
Images are a valuable webpage asset because they make for a strong visual experience on your webpages. However, if you have images on your page that aren't contributing much value, it's best to just cut them out altogether -- especially the ones that are really large.
4. Reduce the file size for the remaining images.
For the images you do keep, use high-quality photos that have a compressed file size. This will help reduce the time it takes to make a HTTP request, thereby reducing load time.
If you're a HubSpot user, you don't have to worry too much about resizing and compressing images -- the HubSpot COS will automatically resize and compress your images when you upload them into your HubSpot file manager. To resize an image further, once you've uploaded it into your file manager, click "Clone and edit," as shown below:
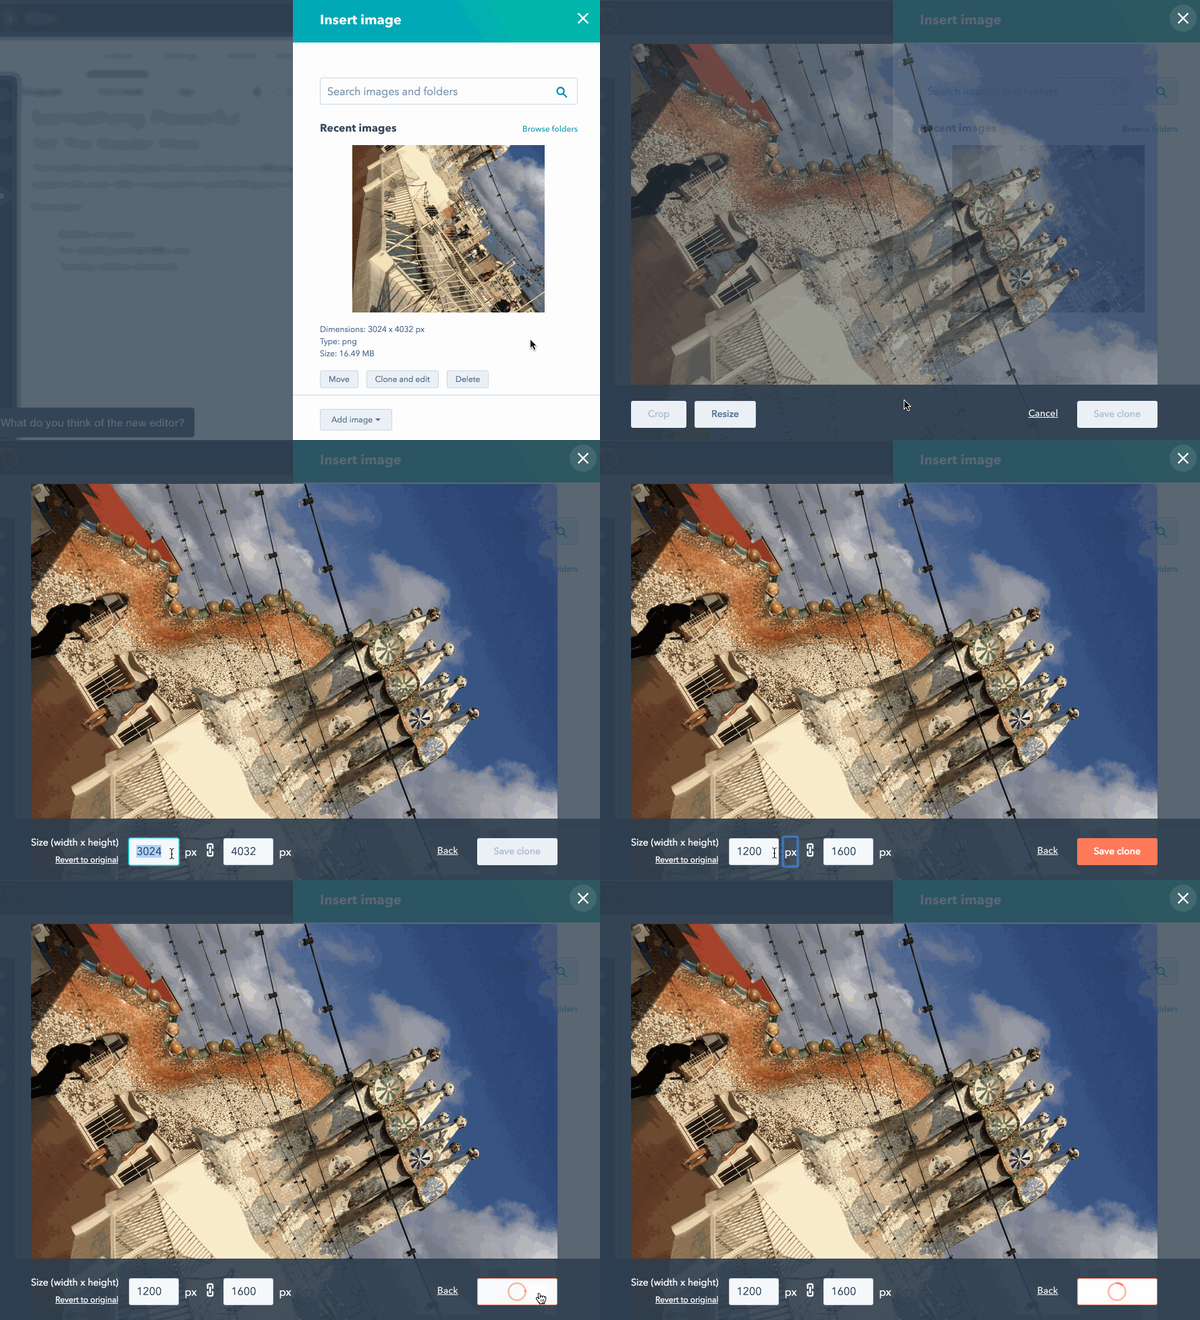
Keep in mind you can always reduce the file size of your images further before uploading them into your website. If you have a webpage with many separate images on it, for instance, it'll behoove you to reduce their file sizes as much as you can before publishing the page.
If possible, we recommend reducing each image's file size to less than 100 KB. Depending on the image, you might need to compromise on this minimum, and that's alright. Just try your best to keep your individual files from entering megabytes ("MB") territory.
To compress your images to their minimum, use a tool like Squoosh, a tool developed by Google to shrink image file sizes at the slight expense of image quality. The more you shrink the file size, the lower the image quality can get -- use Squoosh's sliding compressor meter to strike a balance between quality and size that suits you.
Your time is precious, though, and compressing images one by one can be a tedious task. To compress many images at once, consider using TinyPNG.
5. Set your website to load page files asynchronously.
By default, many websites load the content they receive from top to bottom on a webpage. So, even if a user's web browser performs more than one HTTP request at a time, the content it receives loads piece by piece. This is also known as "render blocking," and it can make your entire webpage load more slowly because each file is waiting its turn to load in a user's web browser.
Setting your website to load content "asynchronously" can override this rule.
Asynchronous loading allows website content to render multiple page elements at the same time, no matter where they sit on the page. On WordPress, there are numerous plugins that can help you do this. HubSpot also allows you to change where a popular JavaScript element known as "jQuery" renders on a webpage so you're not stuck waiting for it to load. See the screenshot below to see this option, and read more about it here.

6. Evaluate other parts of your page that are contributing to page load time.
Cutting and compressing images are a great first step to reducing HTTP requests and page load time. But what else did you see on the Network panel that's adding requests? For example, you might find that a video or Twitter integration adds an entire second or two to your load time. That's good to know. From there, you and your team can decide whether those assets are worth keeping.
5) Make JavaScript asynchronous.
If you have JavaScript on your page that's not asynchronous then you'll want to take it to your developer to make it asynchronous -- or remove it from the webpage altogether, if possible.
Why? It all comes down to user experience. When a person's browser loads a webpage, it loads the page's assets from top to bottom. When it hits a JavaScript file and wants to load it, if that JavaScript is not asynchronous, then the browser will stop loading everything else on the page until it loads that JavaScript file in its entirely.
If that JavaScript is asynchronous, then the browser will load it at the same time as it continues loading other elements on the page. Asynchronous JavaScript files make for a better user experience.
To learn more about making JavaScript code asynchronous, I recommend checking out this presentation by Steve Souders and this blog post by Visual Website Optimizer.
7. Combine CSS files together.
Every CSS file you use for your website adds to the number of HTTP requests your website requires, thereby adding time to your page load speed. While this is sometimes unavoidable, in most cases, you can actually combine two or more CSS files together. (You may have to get help from a developer for this.)
What does this mean? Every time you identify multiple CSS files that look similar, listed in your website's HTML code, you have the opportunity to combine these files into one file so a user's browser doesn't have to make more than one HTTP request to produce these files. Here's an example of a group of separate CSS files before combining them:

Now, take a look at how you can combine all of these files into one line, or file:

Image credit: Apache Incubator
If you use HubSpot, you can combine many CSS files automatically.
CSS code can be anywhere on your site or in any number of files, and it'll still works just as well. In fact, often the only reason a site has multiple CSS files in the first place is because the site's designer found it easier to work with separate files. To learn more about combining CSS files, take a look at this front-end website performance guide.
from Marketing https://blog.hubspot.com/marketing/reduce-http-requests


No comments:
Post a Comment