The funnel has become a key part of the modern-day marketers toolkit. It’s the first report they peak at on Monday morning, and the last report they check before leaving for the weekend on a Friday.
All serious analytics tools have some version of a funnel report, with differing degrees of flexibility and features. Some are narrower, allowing for a limited number of use cases, while others are more full-featured with advanced conditions, date ranges, and advanced segmentation.
Kissmetrics has a Funnel Report of our own. It’s flexible and has a lot of great features that you can use right “out of the box”.
The Kissmetrics Activity Report is a bit of a natural extension of the Funnel Report. It’s great for segmenting into one or multiple event(s).
This post will show how marketers and growth teams can use the Funnel and Activity report in tandem to garner even greater insights through segmentation. Let’s see how.
Funnel Report: Identify Opportunities
The standard funnel use case is tracking the key steps from first visit to conversion. A funnel for a SaaS company may have these steps:
- Visited site – They visited your site but haven’t converted yet.
- Signed up for trial – Visitors signed up for a free trial of your product
- Activated – Some product activation occurred. They installed the JavaScript, added a team member, etc.
- Billed – They decided they wanted to keep the product and started paying for it after their trial expired.
Dropoffs can occur anywhere in this funnel. Most sites get about a 3% conversion rate, so the biggest dip will be from 1-2. But if steps 2-3 also have a big dip, that could signal an issue with your onboarding.
An e-commerce funnel may look like this:
- Visited site – Same as the funnel above – they visited but haven’t converted
- Viewed product – This may or may not be in most funnels, but it’s a necessary step in the funnel
- Added product to cart – they showed enough interest to add a product to the cart
- Purchased – they ordered the product(s)
Dropoffs in this funnel can occur in steps 3-4, and here it is important to “zoom in” with a funnel and view each micro step that occurs between 3-4. There are typically a lot of steps that customers have go through after they add an item to the cart and before they purchase, so it may help to create a funnel just for this flow.
Example
You’re the marketing manager for a SaaS company, and it’s Friday afternoon and you’re going through your analytics data for the past week. You pull up the Funnel Report and spot your opportunity:
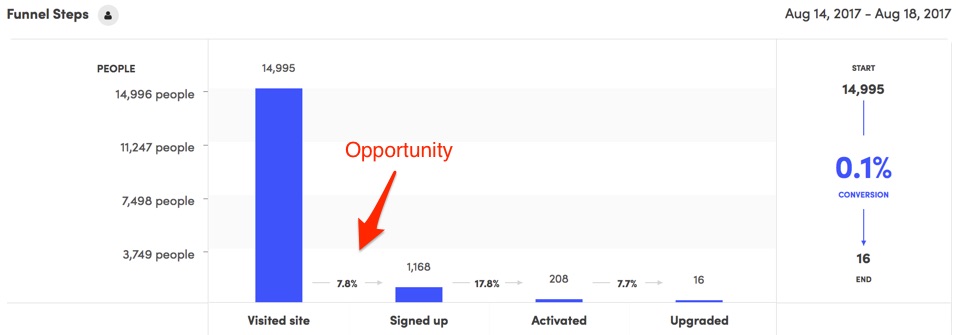
This really isn’t a bad funnel. Most SaaS companies would love a 7%+ conversion rate. And further down the funnel, there’s a solid conversion rate to activating the product (these conversion rates will depend on the complexity of the product and the conditions for the Activated event). The amount of trial users that upgrade is healthy, at 7.7%. A better trial experience, attracting the right customers, achieving product/market fit, and addressing the biggest issues trial customers face can improve this conversion step.
But, there’s always room for improvement.
For now, we’ll focus on improving our signups. Most conversion rates are improved by a/b testing, but in this post we’ll drill down into this signed up event.
Activity Report: Drilldown to Understand What’s Driving the Dropoffs
To use the Activity Report, we’ll simply select the date range and event. Since we want to pick up from our Funnel Report, we’ll select the Signed up event and use the same date range. We’ll run the report and this is what we get:
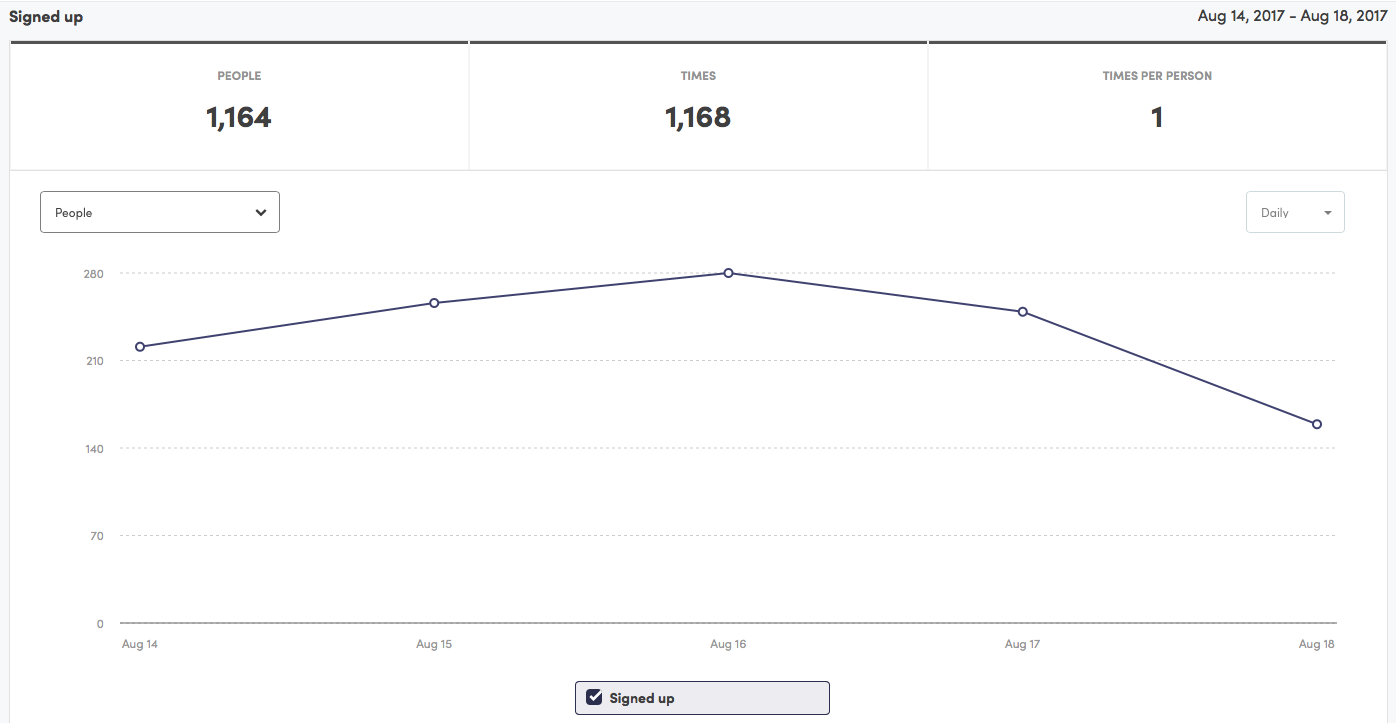
This shows signups per day for that week. We can see that it peaks in the middle of the week, and then falls off, reaching its low on Friday.
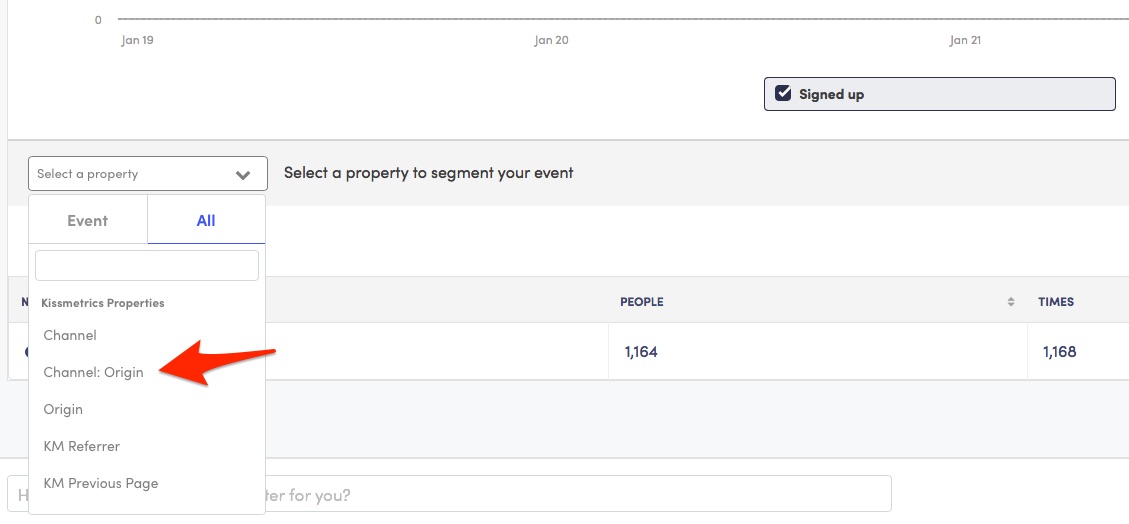
Now we’ll drilldown to see what’s driving these numbers. While we have many properties, there are only a few properties that could be causing this. Since we’re concerning ourselves with a marketing event (a person signing up), we’ll use a marketing property. I like our Channel property. It splits visitors into 6 different channels depending on where they came from.
An extension of Channel is Channel: Origin. This lists the channel and the corresponding URL or Campaign Name. If a visitor came from nytimes.com then their have the Channel: Origin is Referrer: nytimes.com.
Now that we have that, we’ll use the Channel: Origin property as a “first step” to breakdown the signups for that week.
Here’s what we get:
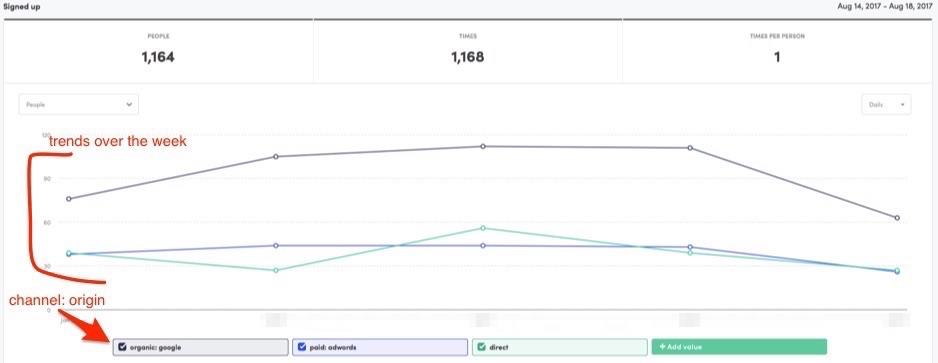
The bottom part of this image is the top 3 channel: origin. We see organic search is where most people came from, then AdWords, and the third is direct. The graph is the visualization – showing us how these interact with each other.
Just at this level, we can already see that our signups are directly correlated with how much organic search traffic we get. If you scroll back up, you’ll see that overall signups and signups from organic: google are tied together.
Underneath this section, we get the numbers:
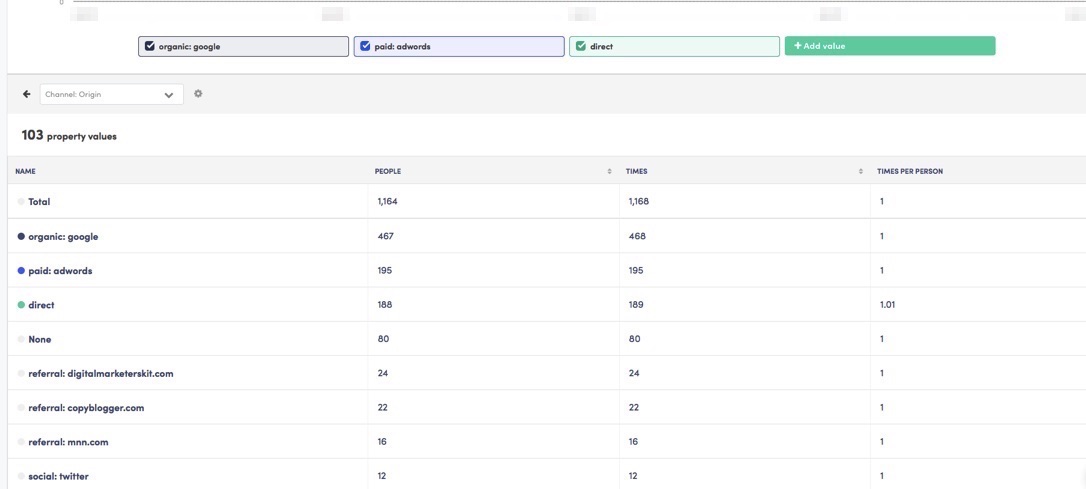
We see there are 103 different channel: origins. We’re only looking at our first few so we can get an idea of what is sending us signups.
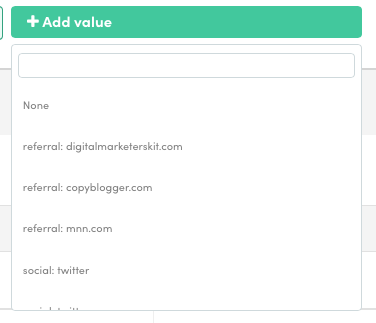
Let’s evaluate the Copyblogger referrer further. To do that, we’ll click the Add value and add that property:
We’ll click the Copyblogger option and get the visualization:
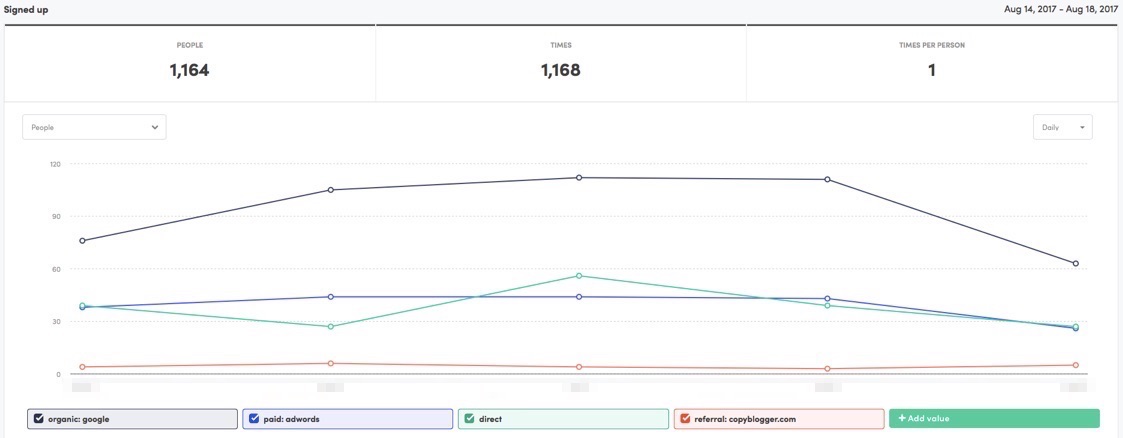
Compared to our others, it’s not adding much. Our first three channels are the ones that are really bringing home the bacon. And with organic being our top channel, we know that we need to keep our organic traffic flowing – otherwise our business will be impacted. This can be considered a risk factor to the business.
Conclusion
Good analytics tools do more than just push data out.
They help you understand what’s driving those numbers by segmenting every metric and KPI you have.
Kissmetrics has segmentation on every applicable with report. The Funnel Report already had top-level segmentation, but with the Activity Report you can drilldown further to truly understand what’s driving (or taking away) conversions.
About the Author: Zach Bulygo (Twitter) is the Blog Manager for Kissmetrics.
from The Kissmetrics Marketing Blog https://blog.kissmetrics.com/drill-down-into-segments/
No comments:
Post a Comment