Friday 30 December 2016

The Biggest Lesson I Learned in 2016: Talk About Who You Are, Not Who You Aren’t

talk about what your brand is, not what it isn't

Author: Janet Dulsky

The new year is upon us which means that it’s time to make our New Year’s resolutions. If you’re like me, you dread making New Year’s resolutions. I always have such high hopes on January 1st, but then I find myself falling back into my old habits by the middle of the month and completely abandoning my good intentions by the end of January.

This year, I’m going to make it easier on myself. Rather than focusing on new resolutions, I’m focusing on applying the lessons I learned from the previous year. 2016 was a crazy year in a lot of ways…an election year (in the U.S.) has a way of doing that. One big learning I took away from the year is to market what your brand is, not what it isn’t.

This is relevant to all marketers. We’re the caretakers of our company brand, and we make choices every day about how to tell our brand story. We often get pressure from our sales teams to talk about our brand relative to the competition. While there is certainly a time and place for competitive comparison, on a day-to-day basis, here are three reasons you want to talk about what your company is, not what it isn’t:

1. You Don’t Want to Be a Body Outline at a Crime Scene

By its very definition, a brand must be something. Heidi Cohen, speaker, professor, and journalist who runs Actionable Marketing Guide, put together a great list of brand definitions from 30 marketers and visionary leaders. A few of my favorites include:

  • “A brand is the essence of one’s own unique story. This is as true for personal branding as it is for business branding. The key, though, is reaching down and pulling out the authentic, unique “you.” Otherwise, your brand will just be a facade.” Paul Biedermann, Creative Director and Owner of re:DESIGN
  • “Brand is the image people have of your company or product. It’s who people think you are.” Ann Handley, Chief Content Officer of MarketingProfs
  • “A brand is the set of expectations, memories, stories, and relationships that, taken together, account for a consumer’s decision to choose one product or service over another.” Seth Godin, Blogger and Best-selling Author

You might notice that none of these definitions talk about a brand as “not our competitor.” The dictionary defines the word negative as “consisting in or characterized by the absence rather than the presence of distinguishing features.” So, when we define our brand by what we’re not relative to our competition (e.g. “Our software isn’t slow, like [fill in the blank]”), we tell our customers and prospects nothing about our company and leave an absence, rather than a presence, in their minds. Your brand then becomes like the body outline at a crime scene. Completely empty.

2. If You Don’t Fill in the Blanks, Someone Else Will

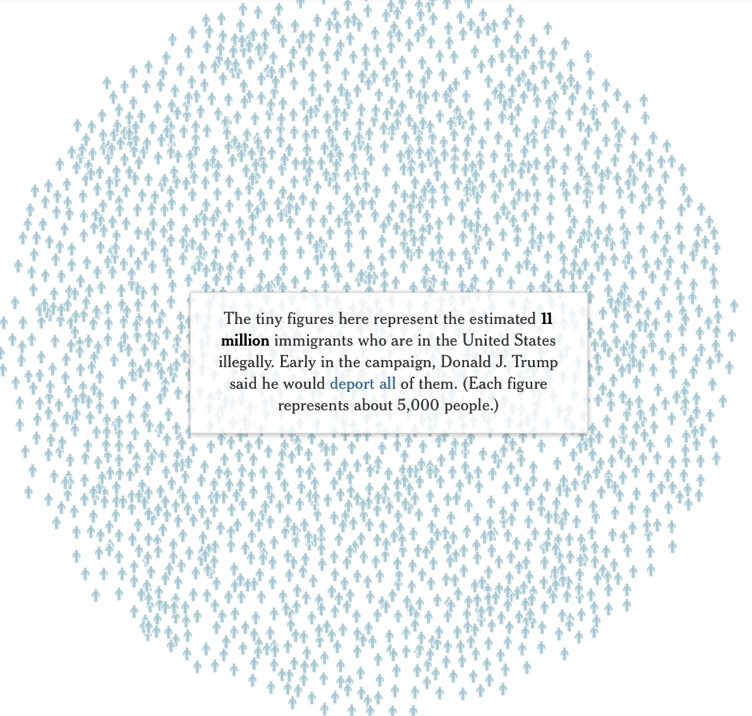
If you don’t tell people about your brand, someone else—likely your competitors—will fill in the blanks. We saw this firsthand during the election, with opposing candidates using the other’s positions on key issues to portray each other in a negative light. Unfortunately, many of those descriptions stuck because there was nothing else in people’s minds about the candidates with which to push back. You’ve heard the expression that “nature abhors a vacuum” and, as a result, nature fills voids. So do people. Everything you say and do should reflect and support your brand message about who you are. That way, when a competitor fills the airways with FUD (fear, uncertainty, and doubt), your company will be like Teflon…those messages won’t stick!

3. People Remember Your Company Based on Their Perspectives

The perspectives that people have about your company is based on what you say about your company and what they have experienced with your company—what you say and what you do. Even if you don’t tell people what your brand is, they will fill the void and create an image in their mind based on what they’ve heard and witnessed. You’re just leaving that image to chance if you’re not staking a claim to what your brand represents and following through with that brand promise through all touch points.

For example, I shop at Costco, which comes with the territory when you’re raising two, constantly hungry, teenage boys. Costco says it is “a membership warehouse club, dedicated to bringing our members the best possible prices on quality brand-name merchandise.” And guess what? I believe implicitly that the products I buy at Costco are a good value. Why? Because over the years, in most cases, my experience with the products I buy there is that they are good quality for the price I pay. This is not to say that I haven’t bought things that were not up to par, but because my consistent experiences with Costco products have mostly been good, that is my perception of their brand.

Brand image is critical to your organization’s success because it not only puts your reputation at stake, but it also influences purchases. To drive this point home, Invesp created an interesting infographic that shows how branding influences purchasing decisions. And let’s not forget that brand is just as important for B2B customers as it is for consumer marketers. In fact, McKinsey conducted a B2B branding survey which found that brand influences 20% of the B2B purchase decision. So, make sure you’re talking about what your company is and that you’re filling in the blanks (not your competitors), and you will build a positive image of your brand in the mind of your potential and existing customers.

What did you learn in 2016 that you’re going to use in 2017? Share in the comments below!

marketo-summit-december-promotion


The Biggest Lesson I Learned in 2016: Talk About Who You Are, Not Who You Aren’t was posted at Marketo Marketing Blog - Best Practices and Thought Leadership. | http://blog.marketo.com

The post The Biggest Lesson I Learned in 2016: Talk About Who You Are, Not Who You Aren’t appeared first on Marketo Marketing Blog - Best Practices and Thought Leadership.


from Marketo Marketing Blog http://blog.marketo.com/2016/12/the-biggest-lesson-i-learned-in-2016-talk-about-who-you-are-not-who-you-arent.html

How to Build Self-Confidence After a Bad Month: 8 Helpful Tips

Regaining-Confidence-compressor.jpg

When you've had a really bad day, the last thing you want to do is spend the night figuring out how to rebuild for the next.

Now, imagine if it were an entire month. Your energy is sapped. You might even feel defeated. And the last thing you feel is confident. Getting up and trying again seems like an ordeal -- one that requires a lot more effort than you feel like making. But you have to.

When we've experienced a prolonged period of negative events, one of the biggest challenges is regaining your personal morale to go back and give it another shot. That's true of dating, and it's true of negative fallbacks at work. We're here to discuss the latter -- and we've got some ideas for how you can get your professional groove back.

Download our complete productivity guide here for more tips on improving your productivity at work.

So if you've had a tough month and you're not feeling so positive, chin up -- we've got a whole collection of tips to get you back on your feet.

8 Tips for Rebuilding Self-Confidence After a Bad Month

1) Talk to your manager.

We are a society that's afraid of looking weak, and it has a bad impact on our behavior. It makes 29% of us reluctant to ask for help at home, and 40% of us afraid to be nice at work -- because we fear that people will take advantage of us.

It makes sense, then, that many of us are afraid to ask for help at work for fear of looking foolish or ill-informed. Not only can that lead to making mistakes in the first place, but it can also leave you without the necessary information to avoid them in the future.

Let your boss know that you recognize where things have fallen short, and ask for specific feedback. Chances are, your manager will appreciate your proactive attitude about mistakes.

2) Ask what “bad” means to you, compared to reality.

"I'm my own worst critic." It's something that many of us say, since we expect perfection from ourselves, which starts at an alarmingly young age. In one study of children in Singapore, researchers found that 60% scored remarkably high on "self-criticalness," with 78% scoring high in "socially prescribed perfectionism." And more than half -- 59% -- were reported to have both.

Yikes. With such a perfectionism epidemic, we wouldn’t be surprised if you’re perceiving your “bad” month to be worse than it actually was.

That’s another place where talking to someone else about it -- like your manager -- can help to put things into perspective. Personally, I have a tendency to assume the absolute worst about everything, especially when it comes to mistakes at work.

But as soon as I bring it up with a colleague or my boss, one of three things usually happen:

  1. It turns out to be a first-time mistake that everyone makes.
  2. It’s easy to fix.
  3. It’s really not that big of a deal.

When we’re so focused on being perfect, we tend to view mistakes as -- at worse -- fireable offenses. If that’s the assumption you make with every typo, missed deadline, or other mistake, your confidence is going to take a huge hit.

Instead, when a “crisis” occurs, try your best to step back and put it into perspective. How bad is it, really? Are you completely powerless to it, or is there something you can do to address it now? Once you’ve fully evaluated the problem -- which should only require about five minutes of deep breath and de-escalation from your panic -- gaining the confidence to tackle the issue might be easier than it first looked.

3) Don’t turn failure into a self-fulfilling prophecy.

As we covered above, many of us allow our perfectionism to manifest as an overreaction to mistakes. If that’s how we constantly behave in the face of performance that doesn’t meet our own standards, could we start habitually expecting failure from ourselves?

Yes. That’s because 70% of us suffer from something called Imposter Syndrome -- the sense that, no matter how much we’ve achieved, we don’t belong in a leadership position or deserve the success of having gotten there. And according to recent research, going through life feeling like an imposter can cause us to bring less confidence (and therefore, less quality) to our work, turning it into a self-fulfilling prophecy.

It’s easy to discount our success as undeserving, and to easily dismiss our hard work. But if we keep sending those messages to ourselves, we’ll start to accept them as truth and it’ll reflect in our work.

However, the opposite is also true -- which psychologist Amy Cuddy touched on in her wildly popular TEDGlobal talk. Since then, she’s continued her research on the power of “faking it until you become it.” That’s when we send ourselves the opposite message of failure, instead reaffirming our power, success, and worth. That approach to work can achieve a reverse self-fulfilling process, in which we learn to believe in our success, instead of feeling like we’re imposters.

Check out this helpful visual guide that explains how body language can help beat Imposter Syndrome. Even by assuming a certain stance, we can instill confidence in ourselves.

4) Evaluate how engaged you are at work.

There’s a problem in the U.S. workplace. Many people don’t really want to be there, as evidenced by the fact that only 34.2% of people are actually engaged at work. In short, that means we just don’t care. And when we don’t care, our work suffers -- how can we bring quality to something for which we have so little passion?

If you feel that disengaged at work, you have a few options. First, you can speak with your manager -- again. Chances are, he or she has noticed your work is suffering, and if you’re able to honestly explain why, that might lead to a productive conversation about the direction of your career. From there, it all depends on how that discussion ends. If your manager isn’t receptive, then it might be time to consider a career change.

5) Formulate a plan for how you’ll avoid another bad month.

Sometimes, there are months in which you really did screw up. It’s okay -- we’ve all been there, which we’ll get to later.

The important thing is that you recognize what went wrong, and that you know how you’re going to prevent it from happening again. When I worked in event planning, we did that for every engagement. We kicked off every project by outlining every possible problem that could arise, but unexpected issues still came up. When they did, we documented all of them and, after the event, formulated a plan to avoid them in the future.

That strategy isn’t limited to events, and most workplace mistakes can be treated the same way. As soon as they’ve been resolved, record them and consider sharing them with your team -- that’s the best way to ensure that they don’t happen again.

6) Know that failure is not uncommon.

'Tis a lesson you should heed:

Try, try again.

If at first you don’t succeed,

Try, try again.”

William Edward Hickson

Not too long ago, two researchers in Texas performed a study on the failure rate of new businesses. Between 1990 and 2011, they found that 92% of the 2.4 million retail businesses that opened during that period also closed during the same span of time. Among the businesses that closed, 25% did so after one year, and 50% closed after two. Roughly 75% of them were owned by first-time entrepreneurs, and 71% percent of the failed business owners didn’t bother trying again.

That last figure is a shame, since the same study also found that the 29% of business owners who decided to try again were more likely to be successful on subsequent tries.

Two things about this study stand out to us:

  1. The commonality and high rate of failure.
  2. The success rate of people who try again.

To the first point, don’t feel isolated in your failure. And as long as you’re acknowledging that making mistakes -- and maybe even failing -- happen to almost everyone, don’t give up, either. As the numbers show, you likely have more to lose by not trying again.

7) Evaluate what you can control.

When things are going so well, it’s easy for us to stop taking care of ourselves. That could be why 39% of adults indulge in unhealthy food when they’re stressed.

While an occasional treat is fine, treating chronic stress with poor nutrition or a lack of exercise will only make matters worse. And here’s the thing -- those are parts of your life that you can control. It’s easy to feel like stressful work situations spiral beyond a solution that you can reach on your own. But self-care? You’ve got this.

Much of the time, constant business travel is blamed for an unhealthy lifestyle, but we’ve got some tips to keep that in check, too -- many of which can also be applied to a busy life at home. Plus, what you eat plays a vital role in your productivity. Check out my colleague Lindsay Kolowich’s guidelines for eating to get more done.

8) Take a break.

Here’s a thought. Could you be making more mistakes than usual because you’re burned out?

In Germany, for example, 24% of employees report feeling burned out. When we’re feeling such a high level of stress from overworking, it achieves the opposite of getting more done -- it actually starts to negatively impact our cognitive function. We start to get forgetful, make mindless errors, and might even have stronger emotional responses to negative situations.

In other words, you need a break. Guilt can get in the way of that -- after all, 55% of us feel bad about leaving our desks just for a breather, and 47% of us are ashamed of taking time off. But the longer we let that trend continue, the closer we get to complete burnout, and the more likely our work is to suffer as a result.

Seriously -- take a break. And maybe even put that vacation time to use. When you come back, you’ll have a renewed perspective that can help you tackle your goals.

Starting to Rebuild

Feel better?

We certainly hope so. As you begin to regain your confidence after a bad month -- or making the effort to do so -- take your time. Evaluate your priorities, and see which of these tips best fits in with them. Don't try to tackle them all at once, or else you might end up feeling overwhelmed, which would defeat the purpose.

Here's to the new year ahead. Best of luck -- we know you've got this.

What do you do to rebuild confidence after a bad month? Let us know in the comments.

free productivity tips


from HubSpot Marketing Blog https://blog.hubspot.com/marketing/build-self-confidence-after-bad-month

Thursday 29 December 2016

Forget Networking: Become a Connector

ThinkstockPhotos-532049662-483225-edited.jpgNo matter how far you advance your career, networking is likely never going to be something you enjoy. And for the introverted among us, it can feel like we’re being forced back into those endless icebreaker exercises we had to do at corporate retreats while we were coming up. So, let’s stop.

Wait, what?

You read that correctly. Let’s stop networking. Instead, let’s start connecting and helping. 

When you start looking at networking as a way to help people, it gets a lot easier. Remember what Jim Rohn once said: “If you help enough people get what they want, inevitably you get what you want.” Here’s how you do it.

Be Approachable

Networking and industry meet-and-greets are inherently uncomfortable, even for the extroverted out there. Thankfully, as someone who has already worked her way up the ladder, you are now the connection people hope to gain. This means that, while you are getting your bearings, you can let people come to you. This is far easier than trying to force yourself to start conversations before you’re ready to do so.

The Buddy System

You’re never too old or too high up the food chain to eschew the buddy system. In this instance, what you’re going to do is pair up with someone extroverted. The extroverts among us are fantastic at taking the leap to make introductions and striking up conversations in uncomfortable environments. As someone more introverted, your strength is keeping the conversation going by asking questions and paying close attention to how the person responds. It’s a symbiotic relationship and can help your extroverted “buddy” as much as it helps you.

Step it Up a Notch

By now you know that networking is about more than the initial meeting. It is about following up on that meeting. The simplest way to do this is to follow each other on social media. The casual nature of social media allows you to keep up with each other without a ton of effort. The connection can grow at its own pace. Reply to their posts. Promote their posts. Inevitably you’ll see one of your connections need something. This is when you make your move. Suggest a solution, offer to help, offer to connect that person with someone you know who can help them, etc.

Build Credibility

This works so well because you’ve already built up trust with your connection. You feel like you know each other already, so helping them solve a problem won’t feel strange or awkward. And it increases the likelihood that your offer will be seen and, more importantly, taken seriously.

Now what you must do is follow through on your offers. The hard part is not promising more than you know you can deliver. One of the best parts of making progress in your career is having the means to lend a hand to those who are still working their way up. Mentoring and helping others advance can become almost an addiction. Therefore, you need to be objective. Apply your business know-how to your urge to help and remember: it is better to promise small and deliver big than to promise big and deliver small.

Grow, Baby, Grow

The nice thing about this approach is that it takes the awkwardness of networking and turns it into an introvert-friendly and organic connection process. Best of all, your initial success will build upon itself naturally over time. It will be the best automated process you’ve ever developed.

People who actually enjoy networking are the unicorns of the business world. Most of the people you meet will be just like you: forcing themselves to do something incredibly awkward that they hate because they know it will help grow their companies. Your urge to avoid it is understandable. Still, try using the method we’ve outlined here. It’s awkwardness reduction properties will make networking much easier to endure.

New Call-to-action


from HubSpot Marketing Blog https://blog.hubspot.com/marketing/forget-networking-become-a-connector

4 Ways Lead Scoring Can Reinforce Your Marketing Strategy and Grow Your Revenue [Ebook]

benefits of lead scoring

Author: Tanya Chu

If you didn’t have much time to delve into your lead scoring this year, it’s not too late to make the business case to do so in 2017! How you structure (and restructure) your lead scoring can give you insights into how your marketing strategy is performing. Even if you already have a lead scoring system in place, it’s a good idea to re-evaluate it as your organization and its needs change.

Here are four ways that lead scoring can make you a smarter marketer:

1. Demographic Scoring Identifies Your Most Valuable Prospects/Customers

The demographic score measures how well your prospects fit your target audience. Some of them include:

  • Title
  • Job level
  • Job function
  • Geographic location

The demographic score is an incredibly important data-driven metric because it tells you the quality of your lead database at the top-of-the-funnel. Just by tracking the average demographic score on a weekly basis, you can gauge whether your database is becoming richer with the prospects that you are trying to attract or not. If the average is continuously going down, perhaps it’s time for you to consider a data vendor to help boost your dataset or take a random sample to see who you’re really attracting with your marketing initiatives.

As you learn more about your prospects and customers, you can develop more tailored campaigns. For example, if you see that director-level prospects tend to sign up for your webinars, then consider creating a webinar track with content targeted specifically for directors. In another example, if you are marketing to your existing customer base, knowing the job function of who is engaging with your content and actively participating in your programs can help you find or create the right content for your cross-sell and upsell efforts. Knowing the overall demographics of your database is also an excellent way to map out nurture tracks to address different interests.

2. Behavioral Scoring Determines a Prospect’s Current Level of Interest

I think it’s safe to say that we’ve all purchased something online before. Most people do their research before purchasing a product, scouring the web for similar products from different brands, comparing pricing and quality, and checking out customer testimonials and demos. These are buying intent behaviors. Other behaviors, like downloading checklists or cheatsheets, signal engagement and curiosity. Behavioral scoring is the categorization of all these behaviors.

At Marketo, we have an organized matrix that pares down all behaviors with respect to different marketing channels and the success level attained, and it is always being updated and tweaked to accommodate for new marketing campaigns. This global matrix keeps our behavior scoring unified across our global offices. Our demand generation team then uses this behavior score in their accelerator programs as a proxy to segment out who they want to send mid-stage versus late-stage material to. Relevancy and timing is key in getting that prospect to fast track to conversion and purchase.

3. Account Scoring Reveals the Group’s Readiness to Buy

Account-based marketing has been huge among B2B organizations, and this shift to account-centric engagement applies to scoring as well. Just as you can score individual leads demographically and behaviorally, you can score accounts based on what you see happening among the group of leads as a sum to check for sales-readiness.

Another neat idea is implementing predictive account scoring, which can be part of the overall account score. For example, if you have analyzed your existing customer base, you can project these insights onto your prospect base to see what accounts may have a greater propensity to purchase. In another use case, account scoring can be used in a whitespace exercise to see what accounts you may be missing in your current database.

4. Lead Scoring Ultimately Drives Revenue

Lead scoring shouldn’t exist only in the marketing realm. Sales needs to be involved in understanding how the lead score is generated and what the thresholds are for marketing qualified leads. One way to validate your lead scoring engine is by bucketing lead scores into tiers and tracking the conversion rates  for each tier of lead scores into closed business. This could shed light on if demographic scoring is overemphasized or if certain behaviors do not need to be scored so high. Then, if your confidence level is pretty high in understanding how lead score correlates to closed-won deals, vetted scores can be used to check sales pipeline estimates and the likelihood of new revenue.

You should also find ways to correlate the lead score to won revenue to reinforce to sales that scoring does work and tune up aspects of leads scoring every quarter. One aspect is understanding the weighting, which I alluded to earlier. Is demographic score driving a high lead score, or is behavior? Should account score trump both these scores with the biggest weighting? Take these into consideration as you discuss with sales what they are seeing in the leads that are being delivered to them.

Lead scoring is a never-ending ongoing process so forge ahead in 2017! And if you’re leveraging an advanced marketing automation, one of the most powerful aspects about it is its flexibility with handling changing business needs and scoring models that reflect them.

Check out our ebook on 4 Steps to Developing a Winning Lead Scoring Model to get started, or refresh, your lead scoring engine.

lead scoring ebook


4 Ways Lead Scoring Can Reinforce Your Marketing Strategy and Grow Your Revenue [Ebook] was posted at Marketo Marketing Blog - Best Practices and Thought Leadership. | http://blog.marketo.com

The post 4 Ways Lead Scoring Can Reinforce Your Marketing Strategy and Grow Your Revenue [Ebook] appeared first on Marketo Marketing Blog - Best Practices and Thought Leadership.


from Marketo Marketing Blog http://blog.marketo.com/2016/12/4-ways-lead-scoring-can-reinforce-your-marketing-strategy-and-grow-your-revenue-ebook.html

The Science Behind the Most Popular Infographics of 2016

Science of Infographics

What makes people want to share an infographic?

Is it a certain color scheme that catches the eye? Do certain formats work better than others? Or, in the end, is it all about the content? At Visme, we set out to answer these questions by performing a content analysis of the most shared infographics on social media.

Using BuzzSumo, we identified every infographic with more than 5,000 shares across some major social media platforms -- Facebook, Pinterest, Twitter, LinkedIn, and Google+ -- and analyzed them for different characteristics. Those were things like word count, size, colors used, format, and topic. Save countless hours using these free, pre-made templates to design your infographics.

Here's what we found after analyzing over 200 infographics -- and takeaways on how you can apply these insights to your own infographics, making them more shareable.

10 Factors Behind the Most Popular Infographics of 2016

1) Most Popular Industries

Most-Popular-Infographics-By-Industry.jpg

Infographics were once used to simplify complex topics with the sole purpose of educating the viewer. Now, they're seen as a highly shareable content format, with the same viral potential as memes -- after all, visual content is 40X more likely to get shared on social media.

That could explain why we found that most of the past year's top-shared infographics were in categories like entertainment, sports, health, psychology, lifestyle, and food. And from the evolution of Justin Bieber’s music, to a visual of Kobe Bryant’s career highlights, the most shared infographics of 2016 also had celebrities as their central focus.

Many of the most popular infographics were also focused on topics personally relevant to readers’ lives, like health and lifestyle tips -- which contrasts from content on politics, global causes, or news.

Takeaways for Marketers

Focus on creating infographics that directly appeal to readers’ personal needs and goals. Creating a buyer persona can help, as it helps you to understand what those goals are.

2) Most Popular Industries by Social Network

Most-Popular-Industries-By-Social-Network.jpg

Certain topics perform better on different social networks. As the site with the most users, for example, Facebook seems to be the place to post content related to entertainment, sports, health, psychology, and education. Meanwhile, infographics with career-related content do best on LinkedIn, where you’re also most likely to find infographics on finance and business topics.

On Pinterest, content related to health, psychology, food and lifestyle perform best. Roughly 31% of online adults use this social network -- compared to 72% for Facebook -- with the majority of users being women.

Twitter, conversely, appears to be the place to post content related to jobs, entertainment, sports, and education. With 23% of online adults using it, it's comparatively lagging among other social networks.

Takeaways for Marketers

When you're developing your buyer personas, figure out where they "live" online. Combined with their interests and goals, that will help you determine where they're most likely to discover your visual content.

3) Most Popular Infographics by Type

Most-Popular-Infographics-By-Type.jpg

Not all infographics are created equal. From timelines, to maps, to charts, to the occasional article that's converted into an infographic -- No one of these visuals is identical to another.

And while some might argue that the last format -- the article-as-an-infographic -- isn't really an infographic since it contains no numbers, we found it to be the most popular one. They don't actually include any statistics, charts, or visualizations. Rather, they contain existing informational content enhanced by colors, icons, and other illustrations.

The second-most popular type in this sample was the how-to infographic, which guides readers through steps to achieve a certain outcome. Within this category are “cheat sheets” -- the infographics that compile all the information readers need to complete a particular task, within a single graphic. Think: keyboard shortcuts for Mac, or baking and cooking substitutions.

For the sake of comparison, here are some additional formats that were included in our sample:

  • Mixed charts: Uses a variety of charts and graphs
  • Single charts: Displays one chart or graph
  • Visualized numbers: Uses icons, colors, and other graphical elements to visualize stats and figures
  • Anatomical: Visualizes the parts of a whole
  • Timeline: Visualizes a chronological sequence of events
  • Location: Visualizes a geographical location through a map
  • Comparison: Compares more than one thing or idea, side-by-side
  • Process: Uses a flowchart or decision tree

Takeaways for Marketers

For the most part -- and to our surprise -- infographics with the least amount of statistics and numbers performed best on social media. The one exception to that rule is a visual cheat sheet, which serves as a quick and handy guide. So when you include data in your infographics, choose wisely and keep it limited.

4) Most Popular Types of Infographics by Social Network

Most-Popular-Types-of-Infographics-by-Social-Network.jpg

To further analyze the performance of different infographic formats, we also examined how each type of infographic performed best on different social networks.

We found that informational and single charts, for example, performed best across Facebook, LinkedIn, and Twitter. Single charts were particularly popular on Twitter, as the nature of the platform favors micro-content.

Cheat sheets and how-to infographics, meanwhile, worked best on Pinterest, which aligned with the topics we found to be most popular on that particular network -- the greatest number of visuals were related to food, cooking, lifestyle, and hobbies.

Takeaways for Marketers

When you create your visual content strategy, plan for a diverse portfolio of infographic formats. That way, you'll have a broad selection of content that you can share across different social networks, depending on where it's shown to perform best.

5) Median Word Count per Number of Shares

Median-Word-Count-Per-Number-of-Shares.jpg

A main purpose of infographics is to present complex information in a visual, easy-to-digest way. As expected, the most popular infographics also had some of the shortest word counts.

In order to account for one outlier in the sample -- an infographic with a whopping 10,500 words -- we calculated the median word count for each of five quintiles within the distribution of this sample, according to shares. Those were ranked from lowest to highest.

From there, we saw that the trend roughly followed this pattern: The more words an infographic contained, the less it was shared.

Takeaways for Marketers

Simply put, keep your infographics short and sweet. In general, they should contain no more than a page’s worth of written content, and even that's a bit on the long side.

6) Median Word Count per Network

Median-Word-Count-Per-Network.jpg

We were also curious to find out if longer infographics performed better on certain social networks. After calculating the median word count of the top 50 most-shared infographics on each network, we found that the shortest infographics performed best on Facebook and Twitter. Conversely, the longest were shared most on Pinterest, LinkedIn, and Google+.

Takeaways for Marketers

Here's where your diverse portfolio of visual content again enters the picture. Aim for Facebook and Twitter with infographics that are mostly comprised of visuals and minimal text. With longer, more in-depth infographics, go for LinkedIn and Pinterest.

7) Colors Used in Popular Infographics

Colors-Used-in-Popular-Infographics.jpg

Color palettes play a huge role in the way an infographic is perceived by viewers. Visuals with color increase a person's willingness to read a piece of content by 80%, but it has to be used correctly.

We found that blue is, by far, the most widely-used color among popular infographics, followed by red and green. Secondary and composite colors that appeared in the sample included brown, yellow, orange, purple, and pink.

But despite the popularity of monochromatic color schemes, there were relatively few infographics that applied variations of a single hue. Instead, most applied between three and four different colors, including such neutral colors as white, black, and grey.

Takeaways for Marketers

Be mindful of your palette when you're creating content. Regardless of social network, it seems, primary colors like blue, red, and green are safe bets -- and perform well across a variety of topics and industries.

8) Median Size of Popular Infographics

Median-Size-of-Popular-infographics.jpg

Here's another category where we had a bit of an outlier -- one extremely long infographic that weighed in at 1,024 by 46,515 pixels. To keep it from skewing our results, we calculated the median size of the best performing infographics on social media.

We found that the median of this sample was 800 by 2619 pixels. That roughly translates to an infographic with a length that's slightly more than three times its width.

Takeaways for Marketers

When it comes to infographics, keep things vertical. That said, keep a healthy perspective on the dimensions -- The best-performing infographics are three-to-four times longer than they are wide.

9) Average Number of Shares by Alexa Rating

Average-Number-of-Shares-By-Alexa-Rating.jpg

Curious as to how site rankings compare to the number of shares received, we also sorted the sample according to ratings from Alexa -- a site that measures traffic -- for the sites on which they were originally published.

We started with the sites that had highest rankings -- and, therefore, the greatest amount of traffic -- and ordered them in descending order to those with the lowest rankings. We then divided the population into five quintiles, as we did in measuring the median word count per number of shares.

The results were a bit counterintuitive. We found that the sites at both the top 20% and bottom 20% of the Alexa rating distribution actually had the least amount of shares. Those that fell in the middle, however, received the greatest amount of shares.

While more data would be required to fully explain those results, it could have something to do with the fact that many mainstream media outlets -- which are at the higher end of the traffic spectrum -- tend not to publish infographics that are particularly shareable, according to the factors we considered in this study. Instead, they tend to publish visuals like single charts that are mostly educational in nature.

Takeaways for Marketers

Evaluate your priorities. Do you care more about shareability, or traffic? Infographics appearing on sites with low Alexa ratings still managed to garner over 20,000 shares. We're big advocates for focusing on creating good content -- if it's shareable, it will attract views. From there, you don't have as much control over where it's shared, regardless of traffic, but no one can accuse you of creating sub-par content.

10) Average Number of Shares by Social Network

Average-Number-of-Shares-By-Social-Network.jpg

Last, but certainly not least, we found that Facebook and Pinterest were overall the best places to share infographics. The remaining social media platforms exhibited significantly smaller averages of total shares.

Takeaways for Marketers

If virality is your primary goal, look to Facebook and Pinterest first. After you see success there, you can experiment with posting your infographic on LinkedIn and Twitter, and evaluate how it performs there.

Make It Visual

When it comes to the importance of visuals in marketing, the numbers speak for themselves -- 71% of online marketers use them in their social media strategies. But with so much visual content out there, especially infographics, it's important to stand out.

As you begin to plan your content for the coming year, keep these tips in mind. Carving out a name for yourself in the world of viral infographics is a good thing -- but maintain the momentum with a diverse portfolio of images.

What factors have made your infographics shareable? Let us know in the comments.

15 free infographic templates in powerpoint

15 free infographic templates in powerpoint


from HubSpot Marketing Blog https://blog.hubspot.com/marketing/science-behind-popular-infographics

10 Marketing Insights for 2017 From Gary Vaynerchuk, Ann Handley & More [Infographic]

Marketing-Insights-for-2017

Looking for a marketing strategy that'll give you that extra leg up in 2017?

While it’s always helpful and entertaining to spend hours absorbed in the blog posts, webinars, and podcasts from your favorite marketing influencers, there’s not always time for that. And with January 1 just a few short days away, you need to finalize your plans -- fast.

So in addition to all that content, why not look at what your favorite influencers are actually doing themselves?

When I went to HubSpot's INBOUND event last month, that was my goal. Before I even got to Boston, my coworkers and I started planning who we wanted to learn from. We made a list, we checked it twice, and we set out to learn from the best.

Guess what? It paid off. While there, we spoke to some of the smartest people in inbound marketing and found out what marketing strategies they’re excited to use more in 2017. That’s not to mention what we learned in their talks and sessions.

Check out the infographic below for some of the most helpful highlights from folks like Gary Vaynerchuk, Peg Fitzpatrick, Larry Kim, and more.

Influencers of Inbound Infographic


2017 Marketing Strategy

from HubSpot Marketing Blog https://blog.hubspot.com/marketing/marketing-insights-2017

Scope Creep Is Killing Your Bottom Line: Here's How to Prevent It

Picture this all-too-common scenario: You're 12 revisions into a client project, when you promised only four. You've now spent almost triple the time you intended on the project, which gives you less time (and energy) to devote to other clients.

It's a frustrating situation, for sure, but the damage goes beyond that -- it's also hurting your bottom line.

Scope creep is the ever-lurking monster under the bed for marketing agencies. A recent Deltek study on agency workflows, for instance, found that nearly 40 percent of agencies exceed their budgets because of scope creep.

It whittles away at your profitability, and when you're constantly handing out a dozen or more revisions, it also sets unrealistic expectations for your clients. If left unchecked, it can mean less time for your agency to grow its business.

Of course, there's a fine line between providing good service to your clients -- which sometimes does require going above and beyond -- and flat-out giving away your services for free.

I'm not suggesting you nickel-and-dime clients to death, but it is essential to set strict limitations on what you will (and won't) do and stick to them. Otherwise, your profits will continue to seep out of the hole you've failed to block up at the bottom of your boat.

Scope Creep Starts with Vague Proposal Documents

It's easy to blame clients for scope creep, but truthfully the blame sits right at your feet. At the end of the day, it's your responsibility to serve as the gatekeeper of your agency's services. Scope creep is entirely yours -- not your client's -- to control.

Vague proposal documents are the number one culprit when it comes to this problem. They lead to over-servicing your clients, which in turn leads to lower profits.

The key: Set limits, set boundaries, and be very specific. Good scope documents include assumptions about both the project and the processes. Clearly outline the ripple effect that will happen if one piece of the project is delayed or altered, and detail how changes should be addressed, should the need arise.

Your clients need to know explicitly what they can and cannot expect from your team. If you specifically outline the deliverables you will provide each quarter, with little room for interpretation, then you'll be setting yourself up for success.

It's a Numbers Game: Know the Math, Increase Profits

OK, so you know you need to tighten up your language on your proposal documents, but where do you start?

Before you add in any additional fees for excessive revisions or change orders, you must intimately know the math and exactly how your agency makes money.

You may find that you are literally paying for the privilege of working with certain clients. If you run profitability reports for your clients (and you should), you might see that certain clients -- those who consistently exceed scope with "small projects" and "just one more revision" -- are actually costing you money.

But it's not just agency leaders who need to be financially savvy. Your account team also should have a clear understanding of how the business works. After all, they are the ones in charge of communicating with the client and monitoring the budget.

If they don’t understand agency math -- or how you spend your AGI -- then how are they supposed to know when to say "yes" or "no" to a client request?

3 Strategies for Stopping Scope Creep in Its Tracks

Scope creep is an issue all agencies face, but it's not impossible to stamp out of your business practices. Here are three strategies to ensure you're both maximizing profitability and providing clients with top-shelf service.

1) Teach Your Employees the Rules of the Game

Every single day, your agency is either making money or losing money.

If your team members don't understand the dollars-and-cents of the business, they will continue to believe their greatest priority is keeping clients happy. The easiest way to do this, of course, is to over-service clients -- not a great tactic for maximizing profits.

if you educate all employees on the costs of your goods and services, they'll be better able to balance keeping clients happy and servicing your firm.

2) Leave No Room for Misinterpretation in Your Scope Documents

At the very least, your scope documents should define your deliverables, the number of revisions you're willing to do, and each project's timetable.

Use language that leaves no room for interpretation, such as "With this estimate, you are going to be granted four revisions. Any revision after the fourth will result in a $250 fee."

The number of revisions and the fee amount should be tailored to your agency, but the important thing is that your client knows from the very beginning of your contracted relationship exactly what they're agreeing to. Once the client signs the document, there doesn't have to be a big discussion every time the fifth revision rolls around.

3) Don't Be Afraid to Issue Change Orders

Change orders give your scope documents some teeth. How you treat changes in scope helps train your clients with how much you're willing to bend. So try not to bend.

The biggest reason change orders aren't issued is that agency leaders and employees think they don't have enough time or it’s not worth the headache. Here's how the thinking usually goes: "By the time I calculate the change order cost, write up a document, and get it signed by the client, I could have just made the change."

The reality, though, is that you can't afford to not issue change orders. By doing this, you'll prevent the client from future abuse of scope. You want to make the client happy, but you are also running a business. And businesses run on profitability.

There will be times when the client or the circumstance justifies waiving that change order fee. But by having the fees in place, those free revisions become a gift you are giving clients, not a right. Giving one revision out gratis sure beats handing out 10 for free -- which is what you may be doing now.

Being specific and firm with your scope won't damage your client relationships. Rather, being firm will train them to get their ducks in a row before they request changes or revisions.

It's tough love, sure, but you'll be surprised how receptive your clients will be to having firm parameters to operate within. Most importantly, you'll no longer have to watch project scope continually creep and profitability shrink.

client-agency-checklist


from HubSpot Marketing Blog https://blog.hubspot.com/marketing/scope-creep-bottom-line

Wednesday 28 December 2016

4 Design Terms Every Marketer Needs to Know

The transition from text-based to visual marketing is already well underway, as customer demand drives organizations to rethink how people communicate on the most basic level.

Cisco estimates video will constitute 80% of all consumer Internet traffic by 2019, and although marketers are racing to catch up, they’re still behind the times: in 2015, 52% of senior marketing executives believed that visual assets such as infographics, photos, videos and illustration could help them tell their brand story. But given that human attention spans dropped a whopping 33% between 2000 and 2015, from 12 to 8 seconds — and some report its dropped even lower — marketers no longer have any choice in the matter: eye-catching visuals that are quick to digest and easy to share will be an essential tool for any brand moving forward.

But what’s a brand to do when you have no idea what visual assets will be both effective and the right fit for your organization? This post will explain a few essential terms and tips you’ll need to get started.

1. Visual Communication

Visual communication may be the most form of all.

It may sound simple enough: visual communication uses images and visuals to create meaning.

Why?

Because it is likely to become the only way that the majority of marketers communicate with their audiences — so you need to know it when you see it. This isn’t just because people prefer video to text, and are more likely to share photos. It’s also easier than ever for any brand to reach an international audience. Just take a look at Google AdWords, which (finally!) launched a redesign in March, of which an essential part of the design was making it language-agnostic to remove obstacles for audiences with a wide variety of backgrounds and skill sets.

new-adwords-design
The new Google AdWords features clean visualization and icons that communicate the type of information being mapped, no matter what language you speak. Image Source

When necessary, limited text is included to explicate the meaning. Take a look at Starbucks’ visual communication strategy: one tweeted image incorporates autumn leaves combined with moss emblematic of their Pacific Northwest roots, announcing that the drink in hand is both seasonal and rooted in Starbucks’ larger tradition.

Starbucks’ visual communication strategy ensures every piece of visual content is immediately identifiable with their brand. In one of Starbucks’ most-liked tweets of the last few months, autumn leaves communicate the seasonality of the drink while moss connects to the company’s Pacific Northwest roots — no text necessary.

Another tweet reminds customers (without using a single word) that the brand is famous for just how personalizable their products are. Their stores and products project the same visual identity as their social pages. You know a Starbucks image immediately when you see it. That’s effective visual communication.

Starbucks communicates its reputation for personalized drinks, the breadth of its product offerings, and its release of seasonal cups — all in a single, text-free illustration.

But it’s easy to fall short of this goal. A great piece of visual communication should communicate in just the same way as the AdWords interface now strives to: without reading a word, you should be able to look at the design and tell what the graphic is about — what message it’s trying to send.

Here are a few questions to ask to determine whether your visual content meets the standards that your audiences will hold you to. If the answer is “no” to any of these, rethink whether your content is really communicating effectively:

  1. Ask someone unfamiliar with the graphic or video to glance at it for 5 seconds. Can she tell you what the theme is?
  2. Are you using illustrations and assets custom-made for the content, as opposed to cookie-cutter graphics or clip art?
  3. Is the content targeted toward achieving a single goal?
  4. Are both the design and the copy calibrated to attract and interest your target audience?
  5. Have you kept text to a minimum?

2. Visual Storytelling

Every brand has a story to tell, but with more stories to choose from than ever before, keeping an audience engaged can be a challenge.

The answer lies in what’s already interesting to your viewers: we’re living in the golden age of television and online video; game and virtual realities are becoming more complex every day; and websites encourage visitors to interact actively with their content. Storytelling today has to be something users can see, interact with or hear before they’ll share.

Take a look at Carrington College’s informational motion graphic on springtime allergies:

It transforms pollen, white blood cells, and even mast cells into humorous characters to reframe what could otherwise be a boring explanation as a story. Every audience is attracted to stories — it seems to be a part of our human DNA. And with the help of clever visual storytelling strategies, anything can become a story.

Visual storytelling uses visual communication to craft a narrative that explains a concept and often evokes an emotional response. It’s ideal for those marketers seeking to share an idea, promote a point of view, or convince potential customers of the quality and effectiveness of their product. As with visual communication, education is one of the end goals, but this approach aims to persuade the viewer to reach a specific conclusion.

Here are a few elements that make for a great visual story:

  1. Plot: You should carefully guide your viewers from beginning to end.
  2. Priorities: Only use the strongest data and arguments. Too much information is overwhelming.
  3. Audience: Identify a single target audience and create a story they can relate to.
  4. Goal setting: If you’re trying to make too many points at once, or share too many ideas, you’ll end up turning viewers away. A targeted, single goal promotes shareability and engagement.

3. Information Visualization

You’ve got more data than ever and no idea how to cull meaning from that data. Or maybe you do know what it means, but it’s nearly impossible to get your colleagues interested in what that data has to say — much less get your customers so excited that they’re willing to retweet that data to their followers. This is where quality information visualization comes in — and “quality” is the keyword.

Information visualization aims to convey meaning as quickly as possible. The primary focus is to educate the viewer, not to persuade them to form a specific opinion. Information visualization can also be aesthetically engaging and even interactive, as The New York Times proves with its visualization of deportation numbers.

trump-deporation-nytimes

Massive amounts of data are made meaningful in The New York Times’ visualization of U.S. deportation numbers. The graphic transforms as readers scroll down. Image Source

But to be effective, you need to use visualizations that stand up to scrutiny, follow mathematical and scientific best practices, and quickly communicate the big picture. Not everyone is up to this task. Here are a few essentials for when you’re visualizing information:

  1. Check your graphs: Using a pie chart for something that’s not a percentage or setting inconsistent scales for your graphs are both big errors that could take center stage instead of your actual message.
  2. Keep it simple: Don’t try to pack too much information into one image. One graph should have one takeaway.
  3. Focus on the message: Getting lost in the data is the opposite of the point. Help readers understand what’s important and why through careful organization of the content, as well as icons and illustrations when necessary.

4. Visual Campaigns

What if you have a more complex story to tell? Most companies do. One piece of content just can’t say everything you need to say.

One piece of content — even if it’s a social post that goes viral or a video that gets thousands of likes — also isn’t likely to assure the long-term success of your company. That’s why more and more organizations are looking at improving their branding by placing more emphasis on visual content and creating a consistent look and feel that will span multiple marketing campaigns and a variety of content types, from motion graphics and interactive pages to infographics and social posts. At the same time, marketing campaigns are now expected to have a consistent and recognizable visual element — something that can be recognized instantly.

Take a look at how Coca-Cola’s one brand campaign launched this year. Its products were available in dozens of countries, with dozens of looks designed for maximum appeal wherever they were sold. It was a massive undertaking, but the company pared down its product design to just four universally recognizable packages.

coca-cola-one-brand

Image Source

Coca-Cola’s old strategy was to create new branding for each new product. Now, they’ve united their global branding with four consistent, and instantly recognizable, colors, each of which is visible on all sides, no matter which way the bottle or can is turned on the shelf.

“When people see this new brand identity, they’ll know they’re buying a Coca-Cola,” explained James Sommerville, vice president of global design.

This is all to say that companies are redesigning all their customer-facing content to offer up a consistent visual message. Here are just a few of the benefits of undertaking a visual campaign:

  1. The consistent use of quality assets across your brand communicates an overall dedication to quality that customers today are equipped to recognize and prepared to appreciate through engagement and sharing.
  2. A single face for your visual content communicates that you’re committed to authentic and honest communication — not changing your stripes with every new piece of content.
  3. Multiple visual assets can reach a broader audience because of their adaptability to different platforms.
  4. A consistent look builds brand awareness.

Conclusion

In the end, visual communication is an indispensable tool for any marketer, but execution is key. Not just any visual content will do the job. Consumers ignore sloppily designed or cookie-cutter graphics in favor of those that inspire — not only in how they look but also in how they deliver their primary message. Armed with these essential terms and a list of dos and don’ts, you’ll be well prepared to avoid the pitfalls as you navigate to the visual communications agency that’s right for your brand.

About the Author: Erin McCoy is the Public Relations Manager for Killer Infographics.


from The Kissmetrics Marketing Blog https://blog.kissmetrics.com/design-terms-marketer-needs-to-know/

Why Your Company Might Need a Content Audit

ThinkstockPhotos-506147556-568616-edited.jpgContent is used as a valuable marketing tool across all industries. From social media content to long-form evergreen content, marketers constantly write to build awareness and nurture  relationships. While the goal of content marketing is clear, many companies forget to track what type of content is actually working.

Even powerhouse Microsoft fell into that habit. At one point the Microsoft.com website had 10 million pages of content but 3 million of them had never been visited. By removing unnecessary and irrelevant content, Microsoft made its customers much happier and learned what type of content works in attracting consumers. And all of that happened by conducting a content audit.

notecard-image-3.jpg

5 Reasons for a Content Audit

There are a variety of reasons that a company might need a content audit. Here are some of the problems that plague companies because of the lack of a content audit.

Lots of Traffic Coming in But Not Many Qualified Leads

Here’s a scary stat: one-third of B2B marketers don’t track where their leads come from. This clearly needs to be corrected in order to figure out what marketing channels work and which should be eliminated. Once your company takes a look at lead generation, you may find that while more and more traffic comes in, none if it is really relevant to your brand.

This is oftentimes a content problem. The content could be attracting the wrong target and therefore no one converts. 56% of survey respondents said they were doing content marketing without a plan. When qualified leads are not coming in, maybe the content was not written with a clear buyer persona; therefore, the content does not address a specific need or pain point of that audience.

Unclear Value Proposition = Unclear Content

Only 7% of leadership teams can explain a clear, common value proposition, but 85% of CEOs say their employees can state the company’s value proposition. This dichotomy leads to very unclear content. If writers do not have a clear picture of the company’s value, then the content will reflect this and appear confusing to the reader. A value proposition helps build relevance for target buyer personas, helping to improve engagement, shares, conversions, and trust.  

Blog Doesn’t Play a Role in Sales

B2B marketers that use blogs receive 67% more leads than those who do not. Many companies, however, do not use the blog as part of the sales process, which means no leads or opportunities come through because of the blog. 

This can be because the sales and content marketing teams are not aligned. The blog should help push leads down the sales funnel, helping to produce qualified leads. A company’s blog can also help provide sales teams useful nurturing content as they help prospects navigate the awareness, consideration, and decision stages of the buying process.

Leads or Sales Goals Aren’t Met

If leads or sales metrics are falling behind, surprisingly this could be because the content strategy is not tied to the sales strategy. Before revising the sales process, performing a content audit could uncover why certain goals aren’t met. Content must aid the sales process, as 41% of businesses say curated content increased the number and/or quality of sales-ready leads.

Blog Subscribers Don’t Read Your Content

If people that actively subscribed to your blog content are not reading it, then a content audit is desperately needed. By finding out why these people subscribed, you can start to get your content back on track. Perhaps with different team members writing, blog content began to drift from its original purpose, making it no longer useful for the audience.

What To Do Next

Before launching into a full scale content audit, take a step back and ask some key questions about the content being created.

notecard-image-1.jpg

  • Is the Content Value-Driven? Does the content align with the company’s value proposition? What are the key value points that relate to your customer and does the content reflect this?
  • Is the Content Persona-Driven? Does your content align to the needs, interests, and opportunities associated with target buyer personas or an ideal buyer profile?
  • Is the Content Results-Driven? Does your content assist in the conversion of leads and sales opportunities? Does the marketing team align efforts with results? Which content assists in conversions of leads and which content does not? Using Hubspot, identify which content directly influencers sales qualified leads.
  • Have You Invested in a Content Strategy? Have time and resources been fully invested to craft the best content strategy? Has this content team continually updated and improve and build upon top-performing content?
  • Are the Sales and Marketing Teams Aligned? Content can play a huge role in sales, so identify the weak points in the sales process and align marketing strategies along those points. Have you found opportunities to support, educate, inspire, and guide buyers through the sales funnel? Content can help with each step, so marketing and sales teams should meet on a consistent basis.

notecard-image-2.jpg

You Probably Need a Content Audit

If you answered no to any of these questions, then it is time for a content audit. A content audit can help improve sales, make your customers happier, and get rid of unnecessary pages that can be bogging down your website, so if you have fallen into any of the traps listed above, it’s time to audit the content on your website.

View more content marketing stats and trends.  

New Call-to-action


from HubSpot Marketing Blog https://blog.hubspot.com/marketing/company-content-audit

How to Leverage an Analytical Legal Strategy to Close More Deals

sales strategy secret from law school

Author: Zach French

“You went to law school?” I get this question all the time, especially during my interview with Marketo last November. Yes, I graduated from law school and yes, I am now a sales development rep (SDR) selling software.

So how does a legal education set you up to be successful in sales? I didn’t have to look far to find ways to apply the analytical and strategic thinking I learned in law school. In fact, it translates almost seamlessly to B2B sales.

The critical thinking I’m referring to is the approach used in the IRAC method, which stands for issue, rule, application, and conclusion. It’s used by almost every single law school student and lawyer in writing out legal briefs, which are used to convince a judge to rule in your client’s favor. Similarly, in sales, you must come up with a strategy that puts you in the best position to win a deal.  In this blog, I’ll explain how you can apply the IRAC method to your presentations and conversations to scale your sales process:

I – ISSUE

In law, the issue is a clear and concise statement of the question of law or fact in dispute. In both criminal and civil court, the defendant’s liability is based on the prosecutor or plaintiff’s attempt to prove a relevant cause of action (e.g. murder or breach of contract), which requires certain factors or elements to be met through evidence. The issue most often arises out of a dispute over a specific factor or element of the cause of action. The best issue statements are both informative and persuasive.

In sales, the successful identification of the issue(s) a prospect is facing derives from a few investigative/discovery calls. By asking the right questions, we can usually unearth an issue relevant to the particular prospect or client. It is imperative that all contributing “factors or elements” are uncovered during these calls. Typically, they stem from dissatisfaction or pain with the current solution, specific departmental goals they failed to hit, or even issues later in the sales process regarding implementation. And the investigative phase doesn’t end with your own acknowledgment of its existence—the prospect/client needs to know that you understand their issue(s). So, restate the issues as you see them and confirm that there is nothing additional to add.

Once you know an issue exists, you must find the rule/answer that is most relevant to that issue.

R – RULE

In law, the rule usually comes in the form of a statute (written, codified law) or precedent (previous cases discussing similar issues). Statutes are intended to be taken at their face value and read for their literal and policy meaning as explained by our legislative law makers. The influence of precedent is determined first by the level of court (supreme, superior, etc.), then by relevance.

For example, if you are arguing over a state issue, you shouldn’t use the U.S. Supreme Court because their rulings are only relevant to federal issues. Instead, use the highest ranking state court, which is the State Supreme Court. As far as relevance, you don’t want to use precedent that discusses one element of a cause of action to prove your conclusion on another element. Without finding the most relevant governing rule, an entire argument can be thrown out by the court.

In sales, the rule will derive out of specific functionality, services, or satisfied customers who previously experienced similar issues. Applying the example above, you won’t want to use case studies or a reference calls from an enterprise customer to convince a 1-2 person marketing team they will be successful. Relevance is king. You want to make sure you provide prospects with information showing how similar companies have overcome similar issues using your product, including the hard data. The business model, use case, and any other contextual similarities make the case study or referral call that much stronger. Since you’ve already broken down the issue based on the elements and factors, you can narrow down the relevant rules more accurately.

Next comes the big question: how does the rule apply to the issue at hand?

A – APPLICATION

In law, application is when you explain why the rule is applicable to the specific set of facts. This is the most important part of the legal brief as well as the sales cycle, yet it is often overlooked. You must explain your selection process for the rule (e.g. state court for state law) and why it is relevant. For example, “in Smith v. Smith, the issue in dispute was element/factor number one to prove the cause of action, the same as that in dispute today.” The ruling is relevant because those set of facts are similar enough to the facts at-hand for the court’s reasoning to apply. If there are differences or counter-arguments, it is equally important to address and dispel them.

In sales, if you can’t demonstrate exactly how your product solves their particular issue, then you will fail to differentiate it from others. For example, you could set the stage with “AB Software was struggling with similar issues because they were using a similar solution.” Then, explain how your product or feature helped them achieve certain results that the prospect/client is also looking to achieve. Always remember to explain why. Maybe it’s a similar business model for a company moving from a similar solution. Maybe it’s a unique use case, but a similar goal or issue. Sometimes, it may even be sheer volume and how your product can handle higher capacities than others. It could be a service issue or trouble with onboarding and implementation.

Think outside the box here, because a direct alignment may not always be clear. Understand relevant terminology and positions to most clearly communicate the application of your rule to their issue.

C – CONCLUSION

In law, your conclusion will refer back to your issue and state that it is a matter of fact or law to close up your argument. This means that it is either clearly written or can be applied closely enough to similar facts supporting your conclusion. Ideally, in sales, your prospect or client has already come to the same conclusion, so take this time to summarize exactly why your product is the best solution for them in two to three sentences.

Overall, effectively applying the IRAC method to sales depends on clearly understanding the facts at hand. Recognize that your target audience is not the same—not every school needs to boost admissions and not every asset manager needs more clients. Maybe the school wants to boost donations through alumni engagement. Maybe the asset manager simply needs to provide a more diverse set of investment opportunities by building relationships with other advisors. Never assume you know the answer to every question.

Take some time to think analytically and strategize. Ask more questions so that you can provide more relevant answers. This model is scalable and repeatable, so if you can find a way to make it work with your style of sales, the sky is the limit.

What other lessons have you learned from different professions that apply to sales? I’d love to hear in the comments below.

marketo-summit-december-promotion


How to Leverage an Analytical Legal Strategy to Close More Deals was posted at Marketo Marketing Blog - Best Practices and Thought Leadership. | http://blog.marketo.com

The post How to Leverage an Analytical Legal Strategy to Close More Deals appeared first on Marketo Marketing Blog - Best Practices and Thought Leadership.


from Marketo Marketing Blog http://blog.marketo.com/2016/12/how-to-leverage-an-analytical-legal-strategy-to-close-more-deals.html