So you converted 3.1% of your visitors last month?
Awesome! How many of them spent more than $100 on their purchase? Or how many were on your Enterprise plan?
And how many of the 3.1% added a coupon to their order?
How many of them came from your Facebook ad campaign?
Don’t know?
That’s a problem.
Here’s why surface-level analytics can lead to bad decisions, and how the Kissmetrics Funnel Report can answer some questions that lead to better analysis and decision making.
How Bad Marketing Decisions Can Get Made
Let’s take this scenario:
You, the Director of Marketing for an e-commerce company, recently launched a Fall ad campaign on Twitter, Facebook, and AdWords. A month later you notice that your purchase conversions increase 1%, so you pour more money on all three ad platforms without knowing which campaigns led the most to conversion.
90% of the boost in conversions may be because of the Facebook ad campaign, but without doing research you’ll put more money on the effective campaign and burn money on the 2 ineffective marketing campaigns.
In another scenario, you see that most of your large purchases ($150+) come from AdWords, yet neglect that channel because it brought fewer conversions (when what you’re missing is fewer conversions but higher total purchase volume).
Here’s how to see the whole picture with the Kissmetrics Funnel Report.
Viewing a Funnel With Revenue Data
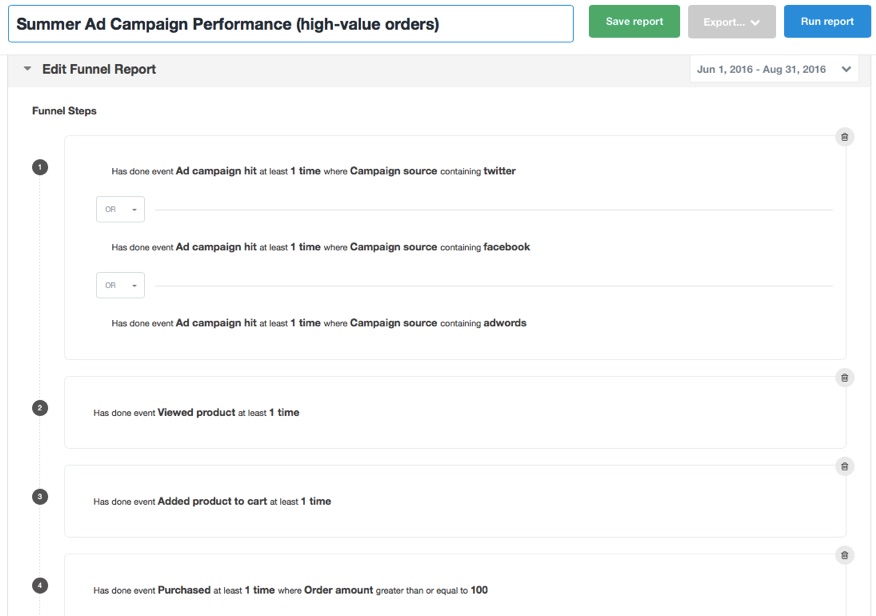
Continuing with the e-commerce marketing director scenario, let’s say we just ran our Summer advertising campaigns. We had campaigns on Twitter, Facebook, and AdWords. We’ve tagged all three with UTMs, which makes for pretty easy tracking across Kissmetrics and other SaaS platforms. We want to see which campaigns brought customers who spent at least $100.
We’ll need to create a fairly elaborate funnel. Here’s what we’ll do.
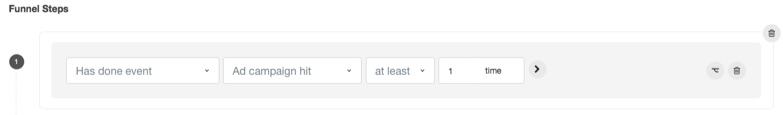
The first step is to look for people who came from an advertisement. We’ll have the first event be “Ad campaign hit”.
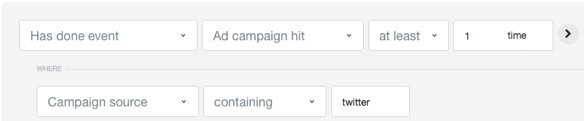
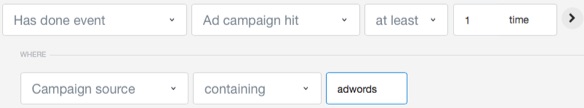
We’ll add additional conditions to this event. This is where we’ll narrow in on these three campaigns and be able to distinguish between each. We’ve tagged each campaign with a respective Campaign source. Twitter has campaign source twitter, Facebook is facebook, and AdWords is tagged as adwords.
Let’s first enter the Twitter campaign source:
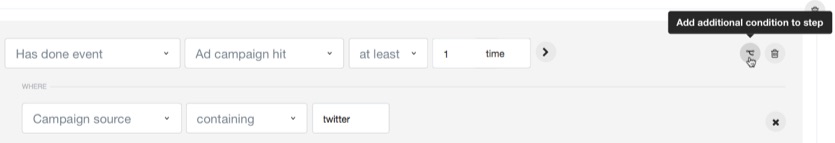
We’ll add an Or condition by clicking here:
We’ll then do the same thing, but this time enter the Facebook campaign source:
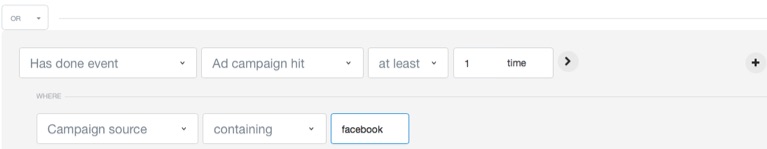
Finally, the + button you see on the right allows us to add another condition. We’ll click it, create the same condition but this time use the AdWords campaign source:
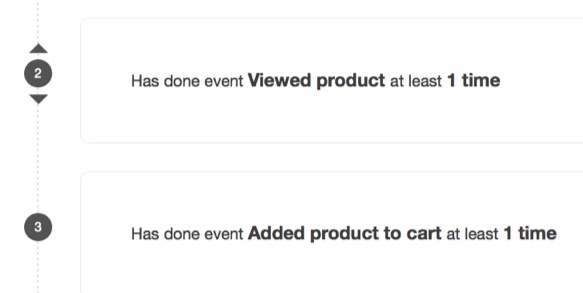
Next we’ll add a step the funnel. Since most people visiting an ecommerce website visit a product page before adding an item to their cart and purchasing, we’ll add those next two steps:
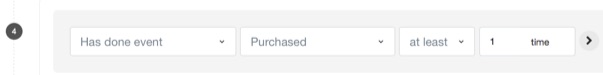
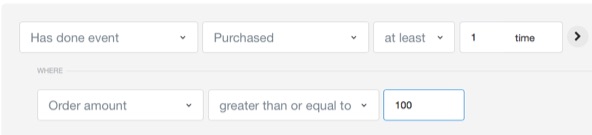
The final step, Purchased, needs some conditions added to it. We’ll look for the customers that have made a purchase of at least $100.
First we’ll add the step:
Click that arrow button on the right and we’ll add that we’re looking for purchases being at least $100:
Keep in mind that your naming of events and properties will probably differ than what I’m showing in this example. We don’t have any default events or properties named Purchased, order amount, added item to cart, etc. You can set this up with a little help from a developer.
UTMs and Ad Campaign Hit are tracked automatically, however.
So here’s how our funnel looks:
That’s it! Now it’s time to run the report and see our data:
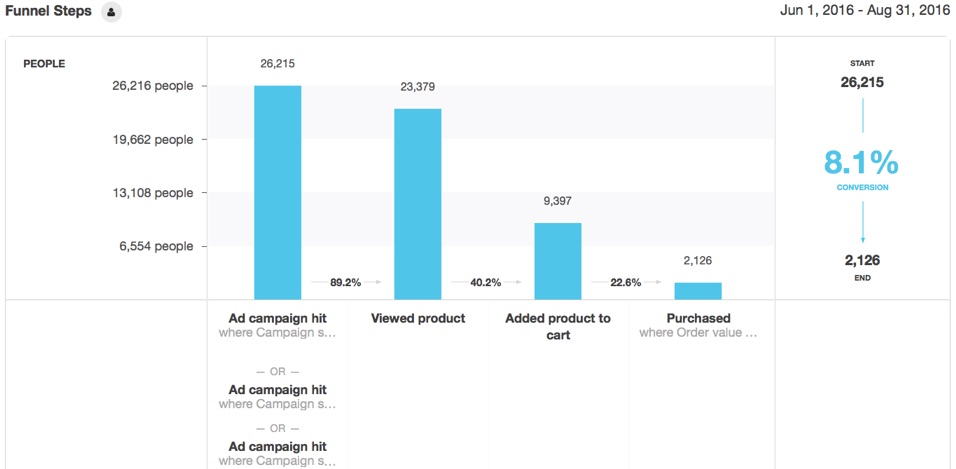
This is looking at all the ad campaigns together. We have pretty good traffic – a little over 26k people, of which about 2k converted to purchasing. Given that all of these people are spending at least $100, we’ve likely made some solid returns on these campaigns (if we were able to keep costs down).
To select each campaign’s performance, we’ll simply click on each of the three Ad campaign hits. Let’s click the top one, which is Twitter’s ad campaign:

The first couple steps of this funnel perform well, but falls off pretty quickly. Only 88 people purchased, leading to a putrid 1.1% conversion rate. This means that the other campaigns are likely performing better. Let’s check Facebook’s campaign performance:
We can see that this campaign is performing much better than our Twitter campaign, with about 10x the conversion rate. We’ll have to check what we’ve spent on both campaigns. If we’ve spent more on Twitter (with fewer views) we know we should definitely cut off ad spend there or try new a new ad set.
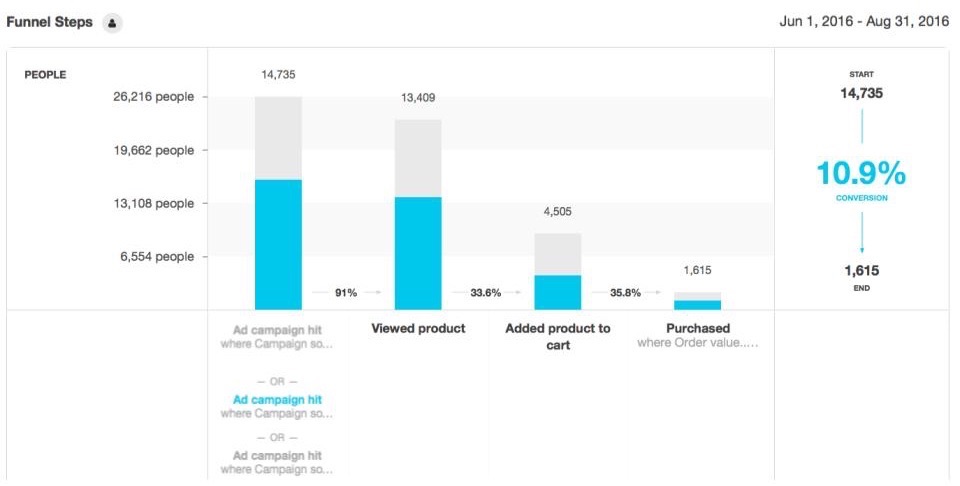
Finally, let’s look at the AdWords campaign performance:

This one is performing even better than AdWords (although both are performing very very well). We achieve a 12.3% conversion rate off about 3,400 visits, making this the highest-converting campaign of the three. We’ll see what we’re spending to see if it delivers a better ROI than the Facebook (and keep in mind that each of these orders are over $50).
What to do with This Data
This data provides great information – we see which campaigns are performing well and which are falling short. We can cut off the ineffective campaigns or try different ads on the platform.
And since these are valuable customers, we’ll want them coming back to purchase again. To remarket to them with ads or drip campaigns, we’ll just click on the Purchased button to find all the people that have purchased:
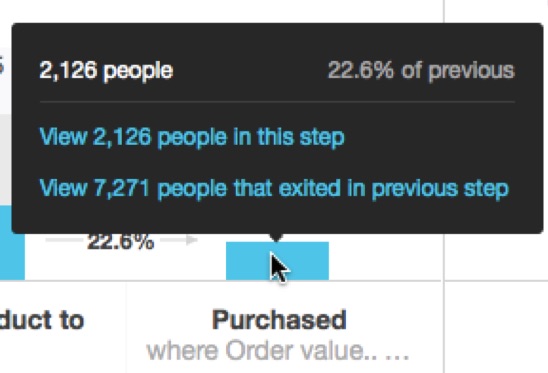
We’ll click those 2,126 people and we can export the list to MailChimp, a CSV, or create retargeting ads.
Where Are Your Marketing Dollars Best Spent?
Want to get more high-paying customers?
First find out where they’re coming from.
With the Funnel Report, you’ll be able to breakdown each marketing campaign and easily track the performance of each. And with the ability to further drill down by only viewing campaigns with high or low revenue from each, you’ll be better able to track ROI.
About the Author: Zach Bulygo (Twitter) is the Blog Manager at Kissmetrics.
from The Kissmetrics Marketing Blog https://blog.kissmetrics.com/most-valuable-campaigns-with-kissmetrics/
No comments:
Post a Comment