As a people-based analytics platform, Kissmetrics tracks users through every step of the growth cycle – from first visit to signup to every step thereafter.
Today, we’re taking the next step in analytics by releasing Populations, a new feature that makes it easier for growth marketers and product teams to track and understand key groups of people across their growth cycle.
With Populations, you’ll quickly see how these critical groups are performing, and in just a few clicks easily segment your Populations for greater insights.
With this new feature, you can stay on top of your growth cycle:
- Track: Create Populations based on any behavior combination they want, to monitor your business growth cycle.
- Understand: Your data is clearly organized around your Populations so you can quickly understand the health of all of your key growth segments at a single glance.
- Focus: Quickly know which Populations are growing or shrinking, so you can focus your initiatives on the Populations that need it the most.
Here’s how it works.
Tracking Your Growth Cycle
Let’s say you’re the Director of Growth Marketing for a SaaS company. You need to keep a constant eye on all areas of your growth cycle, that is:
- Signups
- Activation
- Product usage
Tracking this is actually quite difficult with most analytics tools because you have to go to a series of reports to see what’s going on across the growth cycle. That’s where Populations comes in. In just a few clicks, you’ll be able to see how all Populations are trending, who is in each Population, and you’ll even be able to segment to see the breakdown of the Population by property. Let’s see these features in action.
Overview Page
Here’s a simple example of three Populations common to SaaS growth cycles and how each are performing:
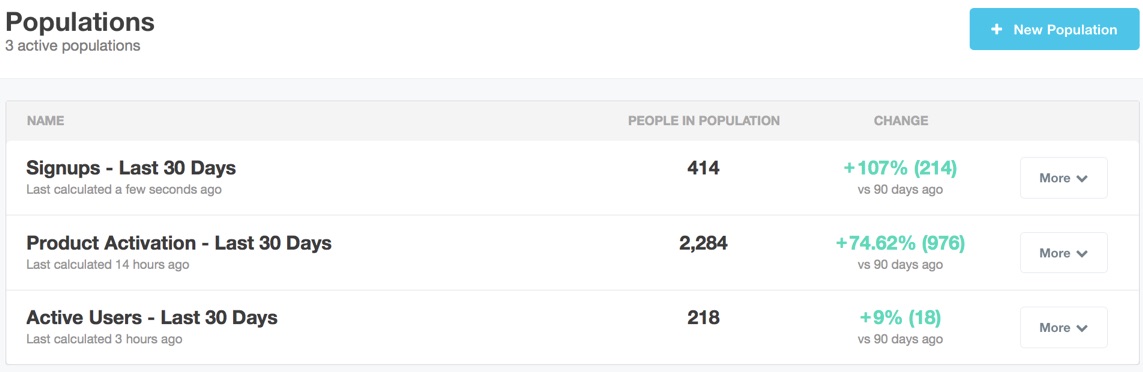
- Signups – These are the people that have signed up for a trial sometime within the last 30 days.
- Product activation – Users in this Population are those that activated the product in some way. Maybe they reached some area of the product where the aha moment is reached.
- Engagement – If people are logging in, they’re likely using your product and are engaged users. People in this Population are those that logged in at least three times in the last 30 days.
This overview gives us some good information about the early stages of customer acquisition and adoption – we see how many people were in each Population, and how it’s performing against 90 days ago. This provides a quick glimpse into where we stand in our growth cycle.
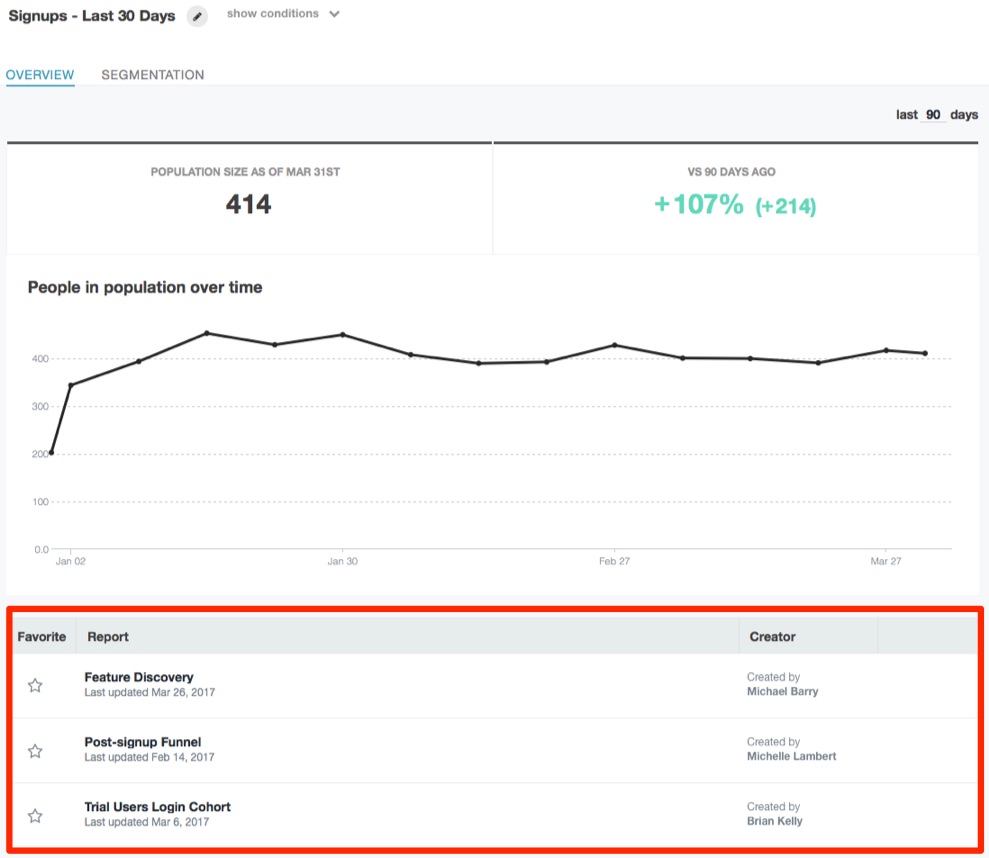
To dig into more detail, let’s see how our signup Population has performed over time. To do that, we’ll go back to the Overview page and click on a Population. Let’s see how signups have performed over the last 90 days.
Populations Page
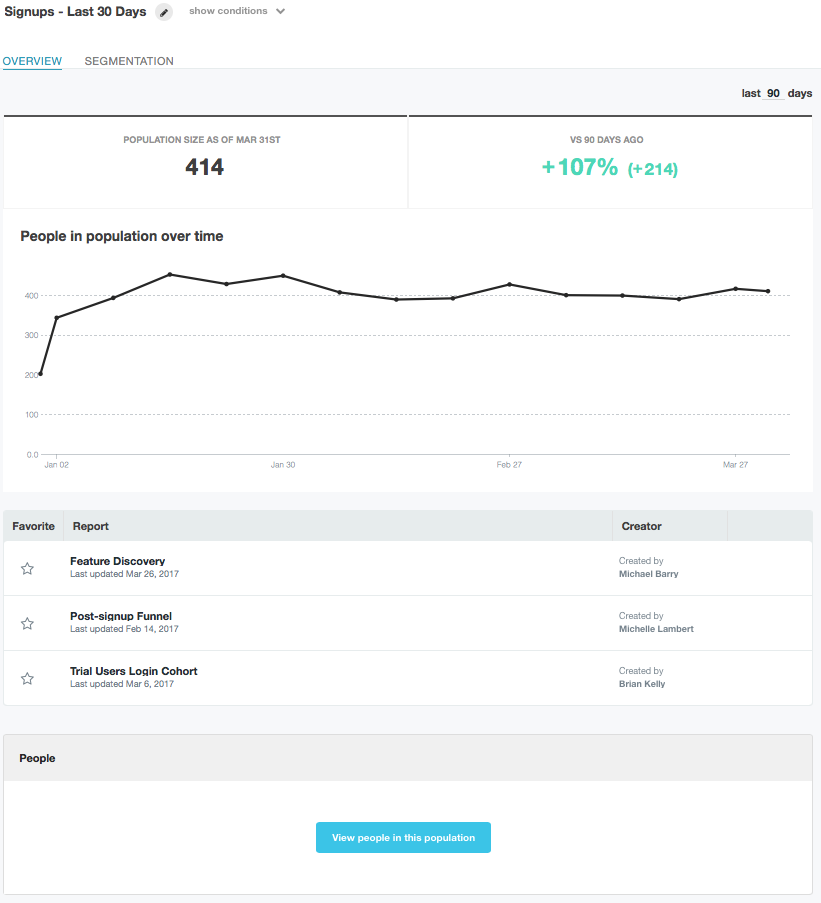
The Population page has a few features:
- See how a Population is performing over time. You can change how far back over time by simply entering a different amount of days in the top right corner.
- You can save the Population to a report (more on this later).
- See every person in each Population by clicking on the blue button near the bottom.
So for this Population, we see that in early January there’s a spike in signups, doubling in just a couple weeks. If there was anything that changed with our marketing during this time, we’ll know that it was the driver of this bump in signups. Often times a conversion bump may be responsible for this sustained increase. It’s also striking that we’ve doubled conversions from where we were 90 days ago. This means that whatever changes have happened in marketing activities have worked in increasing signups.
To see some of the data that makes up the Population, we’ll click on the Segmentation tab.
Segmentation
Let’s see which country is contributing most to signups.
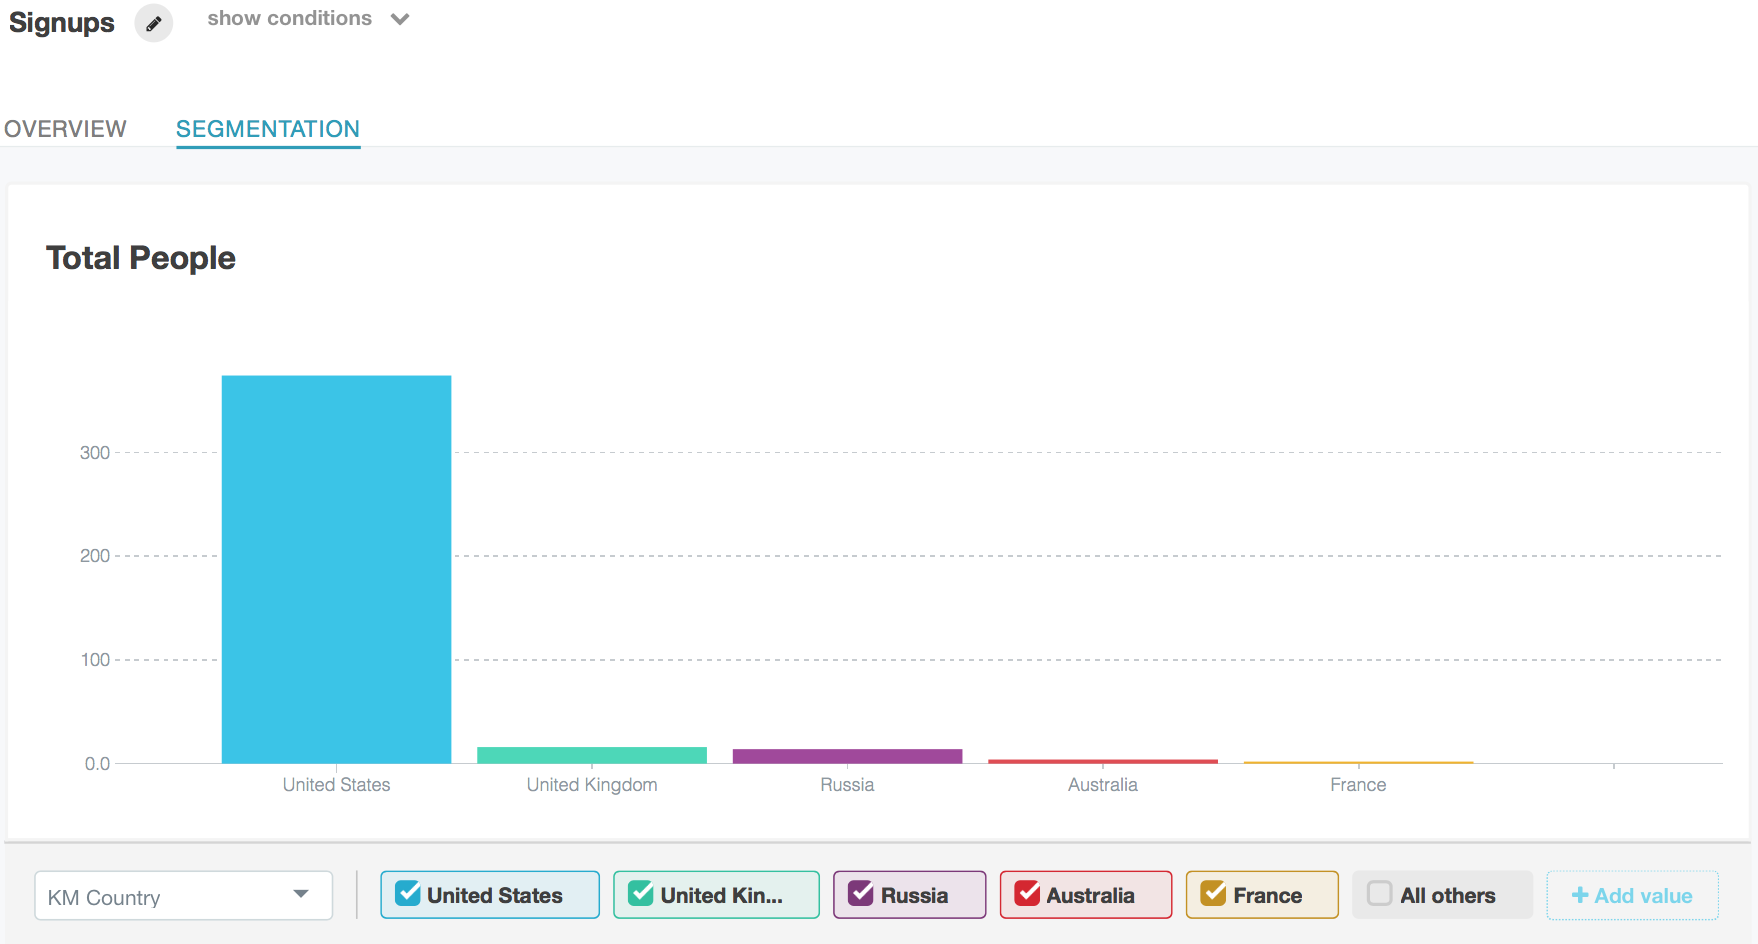
This shows us that the bulk of our signups are coming from the United States. We’ll get a more complete view in this list:
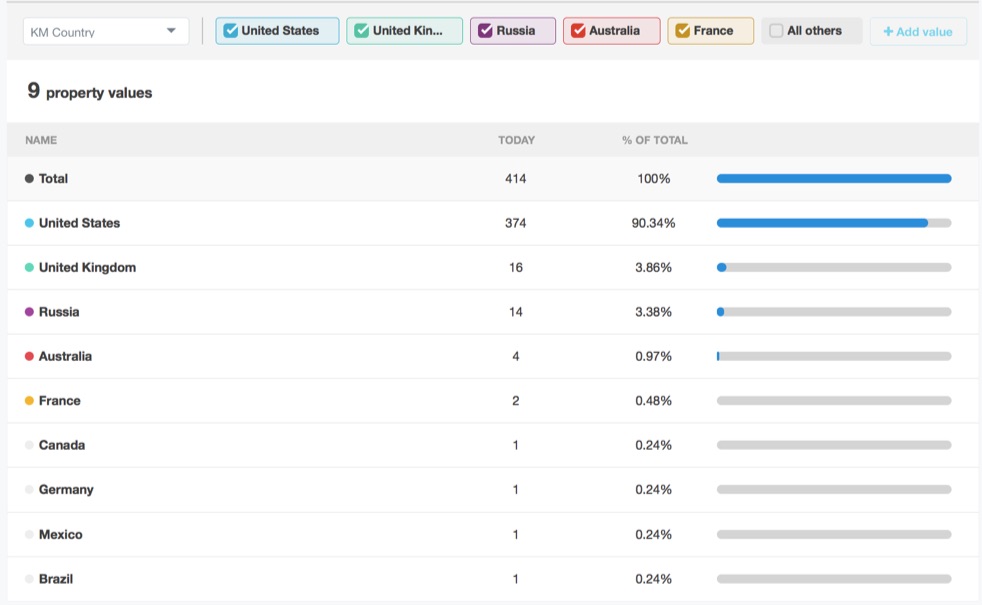
The “9 property values” tells us that all of our signups are coming from nine countries. But over 90% of signups originate from the United States.
Keep in mind that we can break this down by any property we have. We are not limited to just country. You’ll find it best to mix and match properties between your various Populations.
Using Populations In Reports
You’ll also be able to apply a Population to any report. This makes a Population act as a “filter” for any of your reports.
For example, if you want to see how a Population moves through a funnel, you’ll just create that funnel and apply a Population to the report.
When you save a report with a Population, you can access it from the Overview page:
Click on one of those reports, and you’ll get the report that only has the people in that Population:
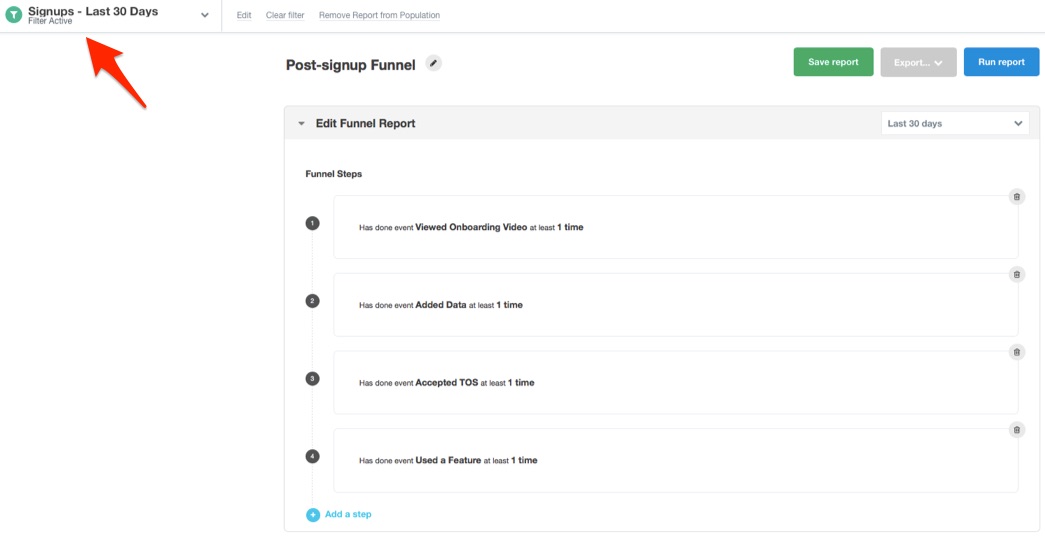
And we’ll have a funnel only for the people in our Signups – Last 30 Days Population. This helps us narrow down a specific Population to see how it is performing. We can use any report for a Population; we aren’t limited to just the Funnel Report.
Common Populations Use Cases
Many of our early beta testers used Populations to track key parts of their business. SaaS companies find it useful to create these Populations:
- New monthly visitors – Go beyond just tracking the total amount of people coming to your site. Create a Population to find how many new visitors have come to your site without ever previously visiting. Then segment it to see what’s driving the Population.
- Active trial users – Getting people to see the value of your product during the trial phase is the most important step to getting them to convert to paying for your product. Creating an engagement to track active trial users (the ones who are actually using the product) will help provide clues as to whether your trial process does a good job at showing customers your product value.
- Monthly trial conversion – Tracking the conversion from those trial users into paying customers will help you see if the changes you make over time are impacting this conversion.
- At-risk customers – Engagement is crucial for SaaS companies, and if users aren’t logging in, it may be an indicator of a future churn. Track these people and prevent the churn before it happens by creating a Population.
E-commerce companies will benefit by using these Populations:
- Monthly buyers – Purchases are the lifeblood of e-commerce companies. How many people bought this month? How many of those were new customers purchasing for the first time? Tracking these Populations can help you understand how your overall sales are performing.
- Loyal purchasers – Repeat purchases are necessary to sustain an e-commerce company. A Population that tracks repeat purchasers over time will show if you’re gaining loyalty or if you’re losing it.
- One and done buyers – Are there people that purchase but never return to buy anything again? Hopefully not, but with Populations you’ll quickly and easily see how many (or how few) one and done buyers you have.
- Browsers – How many people are browsing your store without buying? If there’s a lot (of a large percentage of your overall traffic) it may indicate that your site doesn’t convert well or it isn’t attracting your target audience.
The list doesn’t stop there. We know that each business is unique and has their own KPIs. Track those important benchmarks and anything else that is important to your product and marketing with a Population.
Watch Our Demo
Want to see Populations in action? Click Play below:
Try Populations For Yourself
If you’re already a Kissmetrics user, you can login and Populations will be ready to use.
If you’re not a Kissmetrics user, you can signup or request a demo to learn more about our tool.
from The Kissmetrics Marketing Blog https://blog.kissmetrics.com/kissmetrics-populations/
No comments:
Post a Comment