Analytics is a big part of online marketing and therefore, it’s essential to have a good understanding of how to interpret numbers.
In this post, I’m going to present four statistical concepts I believe will be valuable to anyone working in online marketing.
Statistics: A Sexy Skill
To some people, statistics may sound like a boring topic, but to others, it may very well be one of the most attractive skills. Hal Varian, Google’s chief economist, even calls it sexy:
I keep saying the sexy job in the next ten years will be statisticians. People think I’m joking, but who would’ve guessed that computer engineers would’ve been the sexy job of the 1990s? The ability to take data—to be able to understand it, to process it, to extract value from it, to visualize it, to communicate it—that’s going to be a hugely important skill in the next decades […]
The first three abilities mentioned by Hal Varian is all reflected in the quality of your work. That is the ability to understand, process and extract value from data.
And the last two – that is the ability to visualize and communicate data – are reflected in your relationships with clients or your boss. Good work is worth nothing if you can’t communicate it to your clients.
In LinkedIn’s yearly summary of the hottest skills you will also find statistics in the top:
Data isn’t going anywhere. Our top skill category last year, statistical analysis and data mining, is still sitting comfortably at #2. It is the only skill category that is consistently ranked in the top 4 across all of the countries we analyzed. We still live in an increasingly data-driven world, and businesses are still aggressively hiring experts in data storage, retrieval and analysis.
So let’s take a look at some of the statistical concepts online marketers should know.
1. The Pareto Principle
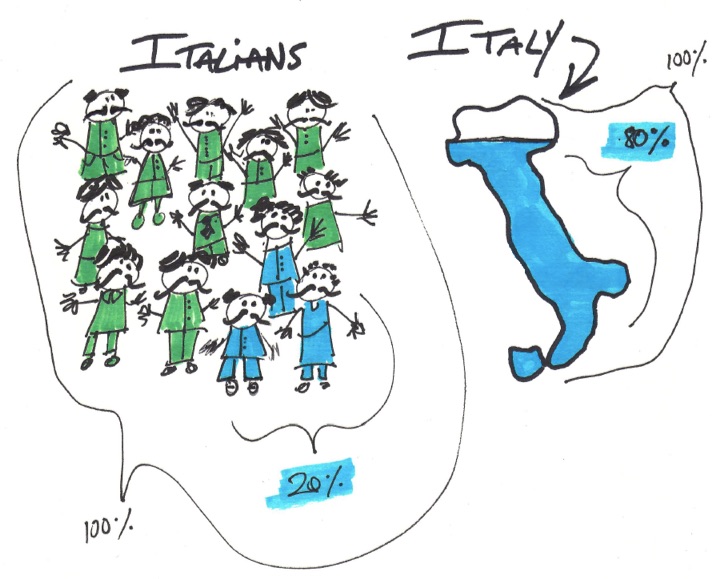
You have probably already heard about the Pareto principle. You may know it as the 80/20 rule as it states, according to Wikipedia, that “for many events, roughly 80% of the effects come from 20% of the causes.”
The principle is named after the Italian economist Vilfredo Pareto who found that 20% of the peapods in his garden contained 80% of the peas and 80% of Italy’s land was owned by 20% of the population.
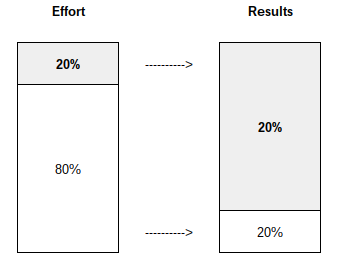
The Pareto principle occurs frequently, and by knowing this, you will be able to take advantage of it. If you can figure out which 20% of your time produces 80% of your business’ results, you can spend more time on those activities and less time on others.
Do you need to restructure an AdWords account but don’t have the time for a complete makeover? You can start by identifying the 20% keywords currently bringing the most sales and start from there.
Or maybe you need to increase conversion rates by optimizing the landing pages on a website with hundreds of landing pages? Again, you will probably find that around 20% of the landing pages are generating 80% of the conversions. So why not start there?
The Pareto principle is a simple heuristic that is often useful in online marketing.
2. The Law of Large Numbers
The law of large numbers tells us that if you repeat a random experiment often enough, the average of the outcomes will converge towards the expected value.
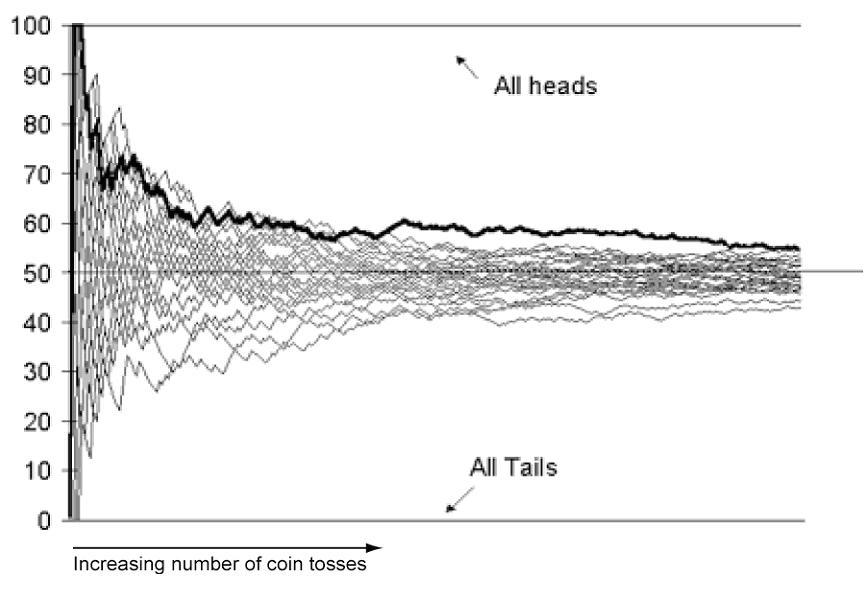
Take a series of coin tosses for example. Heads and tails have equal odds so you would expect each side to come up half the time. But if you were to toss the coin 10 times I bet you wouldn’t be too confident that each side would come up exactly 5 times. You can easily imagine scenarios where heads would come up six or seven times instead of five. Actually, it wouldn’t be too hard to imagine getting even eight heads out of ten tosses (there is more than a 4% chance of this happening).
Now, what if we changed the number of tosses from 10 to 1,000? Would this change anything? According to the law of large numbers, it should.
With ten tosses the thought of getting 80% heads wasn’t unheard of. But can you imagine tossing a coin 1,000 times and getting 800 heads? I doubt it. And rightly so. The chance of this happening is so small I would need 86 zeroes to type it out. With 1,000 tosses you would expect something closer to an equal amount of heads and tails than with 10 tosses.
So our coin tossing example illustrates quite well what the law of large numbers tells us: The more we repeat a random experiment, the more will the outcomes converge towards the expected value.
In his superb book Thinking, Fast and Slow, Daniel Kahneman tells the story of a large investment by the Bill and Melinda Gates Foundation. Some researchers had tried to identify the most successful schools in the hope of discovering what distinguishes them from others.
One of the conclusions was that the most successful schools, on average, were small. And it’s not difficult to come up with possible explanations for this. Maybe smaller schools can give more personal attention and encouragement than larger schools.

Because of this, the Gates Foundation invested in the creation of smaller schools, even splitting large schools into smaller ones.
The problem is it’s wrong. As Kahneman writes:
If the statisticians who reported to the Gates Foundation had asked about the characteristics of the worst schools, they would have found that bad schools also tend to be smaller than average. The truth is that small schools are not better on average; they are simply more variable.
Just like a small number of coin tosses are more variable than a larger number, a small school is also more variable than a large school.
How is this relevant in online marketing?
Let’s say you want to investigate which cities have the lowest conversion rate on your website. You might go to the Geo report in Google Analytics and sort by conversion rate in ascending order. And there you have it. The 10 cities with the lowest conversion rate. You might very well reach a conclusion similar to the statisticians reporting to the Gates Foundation: the low converting cities are all rather small.
But before initiating a big national campaign to increase brand awareness in small cities, you should take a look at the cities at the other end of the table. These high converting cities are probably also small. So perhaps the small cities are not worse or better than larger cities. They are probably just more variable due to fewer visitors.
The same applies to A/B tests and this is why you need a certain amount of data before you can rely on the results from an A/B test and call it statistical significant.
So what are we to do about it?
We should not make too hasty generalizations. The fallacy of making an assumption based on a small sample group is sometimes called the law of small numbers.
In cases like this where you are trying to identify the characteristics of the best or the worst of something, it would be wise to always check the other end of the spectrum. Sometimes you will find that the top and bottom share the same characteristics.
Let me show a final example. The graph below shows the value per session for every hour of the day. At first, it may seem like some of the nighttime hours are the most valuable hours of the day. But instead of just rushing to a conclusion we should consider the least valuable hours of the day. It appears that they are also at night.
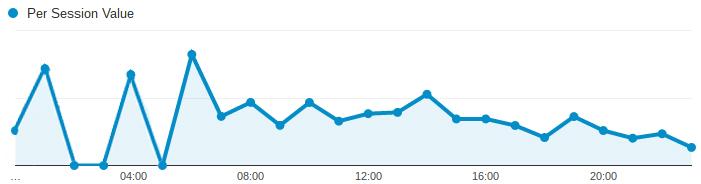
Is there some reason why the data for the nighttime hours should be more variable than the rest of the day?
As the graph below shows, we only get a very small amount of traffic at night. This is just like the schools. One hour at night is like one small school. It could be really good (like 1, 4 and 6 in the morning) or really bad (like 2, 3 and 5 in the morning). But the difference might as well be due to randomness.
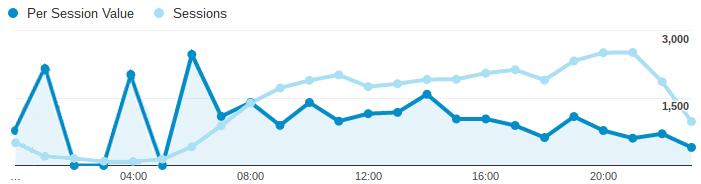
The law of large numbers tells us to put more trust in the value of the hours with many sessions than in the hours with only a few sessions.
3. Relative and Absolute Numbers
Imagine reading about a new drug that reduces the risk of getting a dangerous disease by 25%. At first, this might sound very promising but does it really tell us what the real benefit of taking the new drug is?
Let’s assume 20 in 1,000 people get the disease without the drug. By taking the drug, this number is reduced to 15 in 1,000 people. While this is indeed a 25% relative drop, we should also consider the absolute reduction.
In absolute numbers, the new drug has only reduced the number of people getting the disease from 20 in 1,000 to 15 in 1,000 people. So while it’s true that 25% fewer people get the disease, it’s also true that the actual risk of getting the disease is only 0.5 percentage points lower (reduced from 2.0% to 1.5%). Depending on potential side effects the new drug may not sound as promising anymore.
There is one important distinction to be made here. Percentage change must not be confused with a change in percentage points.
How is this relevant in online marketing?
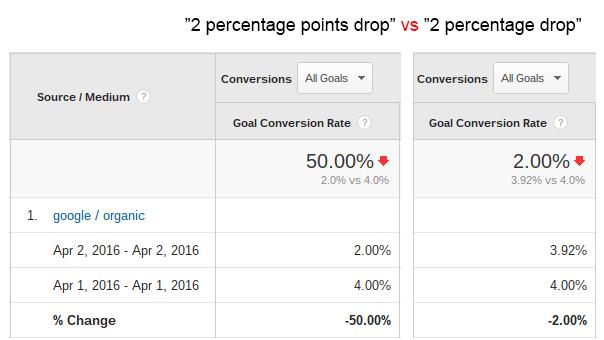
If someone told you that the conversion rate of your website had been reduced by 2% you need to be sure what is implied by this number. Your reaction should be considerably different if the person meant to say the conversion rate has been reduced from 4% to 2% (a drop of 2 percentage points) than if it was just a reduction from 4% to 3.92% (a 2 percentage drop).
When talking about changes we need to make sure everyone knows what the numbers mean. Are we talking about the relative or absolute numbers? Are we using percentages or percentage points?
We also need to be especially wary of relative numbers when the starting point is a very small number. If your AdWords campaign is generating 50% fewer conversions, you won’t panic if it is just a drop from 2 conversions to 1. But if it’s a drop from 2,000 to 1,000 conversions then you might consider panicking. A drop of 1 conversion is probably just a random fluctuation while a drop of 1,000 conversions might be caused by a serious issue.
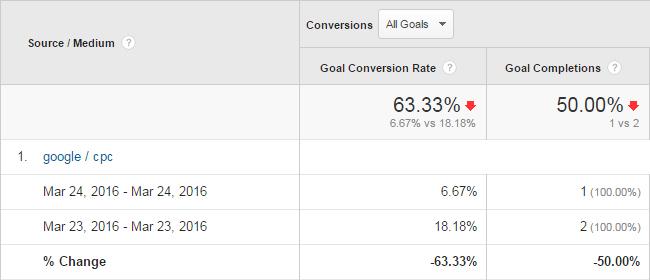
In the example above you can see exactly how percentages will mislead when the absolute numbers are low. While the goal completions is down by 50 percent and the conversion rate is down by 63 percent, the actual change in goals completed is just 1. Not exactly something that would make you panic.
It just shows how percentages can be misleading when the absolute numbers are omitted.
4. Simpson’s Paradox
Simpson’s paradox, as stated on Wikipedia, is the name of a paradox “in which a trend appears in different groups of data but disappears or reverses when these groups are combined.”
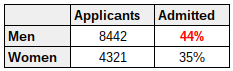
A textbook example of the Simpson’s paradox is the study of the 1973 admission figures for the University of California, Berkeley. The numbers showed that men applying were more likely than women to be admitted. 44% of all the men who applied got admitted while only 35% of women did.
The paradox arises when examining the individual departments since it appears that no department was significantly biased against women. As shown below, four of the six departments actually had a small bias in favor of women.
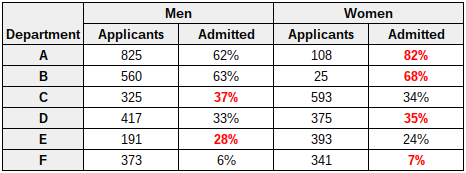
If you take a closer look at the number of applicants in the six departments, you will see that women tended to apply to generally competitive departments with low rates of admission (C, D, E, and F) while the majority of men applied to department A and B which have the highest admittance rate for both sexes.
So while the rate of women accepted is higher in 4 of the 6 departments, the total rate of admissions was higher for men because more men applied to departments with high rates of admission.
How is this relevant in online marketing you might ask?
Say you want to compare the performance of two landing pages on your website. Looking at the conversion rates you conclude that page A is better than page B since page A has a conversion rate of 4.39% compared to only 3.49% of page B.
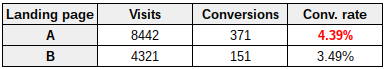
But look what happens if we segment the two landing pages by the traffic sources as shown below.
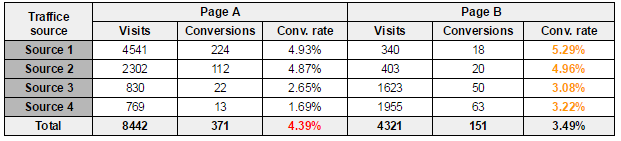
Now we see that even though page A has a higher total conversion rate, page B is actually doing better for every individual traffic source. Page A is not better; it just happens to get a lot more of its traffic from the high converting traffic sources than page B does. This is Simpson’s paradox – just like the example with college admission figures.
So what are we to do about it?
First of all, we should make sure to run properly randomized trials. If the numbers above were from an actual split-test of two landing pages, it would clearly be flawed since the traffic sources are skewed that much.
Apart from that, we should remember to always segment our data. As Avinash Kaushik wrote in a blog post: “There is no KPI so insightful all by itself, even in a trend or against a forecast, that it can’t be made more impactful by applying segmentation.”
Conclusion
I hope you have found the four statistical concepts interesting and hopefully learned something new to help you in your work.
Knowledge of statistics will only get more important in online marketing, and by educating yourself, you can make sure to stay ahead in a world where we are getting access to more and more interesting data.
As Hal Varian said, the sexy job in the next ten years will be statisticians! And with the combination of statistical skills and online marketing you will possess some of the most attractive skills at the moment.
About the Author: Frederik Hyldig is the Head of PPC at s360 – one of the leading digital agencies in Scandinavia. Frederik has been featured on PPC Hero, Wordstream, Moz and other leading search marketing blogs.
from The Kissmetrics Marketing Blog https://blog.kissmetrics.com/four-statistical-concepts/
No comments:
Post a Comment