One of the more loaded questions we hear from execs at our SaaS company is, “How is Marketing doing this month?” Fair question.
For B2B marketers who work with lead generation and conversion tracking, the answer beyond “great” may be tricky to communicate, based on whom we’re talking to and all the factors involved.
Ideally, your lead conversion tracking data is presented in a way that can answer any sophisticated marketing performance question in under two minutes without overloading the recipient. They need it this way.
Let’s dive into some key B2B lead conversion tracking methods for win-win clarity.
1. Lifecycle Stages
Every B2B company is unique. More often than not, your funnel is unique too, making it extra important to clearly define the lifecycle stages of your leads based on the interactions they’ve had with your business (not only for marketing purposes, but for tracking as well).
For example, the way you communicate with and measure leads who have a contract in hand vs. leads who have downloaded an ebook should be much different. Lifecycle stages are the base of strong lead conversion tracking.
Here’s one way to define your lifecycle stages, from awareness to enlightenment:
- Subscriber: Those who have read some of your blog content and opted to hear from you via one of your various email sign-up strategies. They might not know what it is you sell or do, but they find your content valuable.
- Lead: Those who have shown interest in a general, top-of-the-funnel offer.
- Marketing Qualified Lead (MQL): Those who have provided detailed information such as company name, job title, etc., to receive gated content (depending on your form fields) like whitepapers, data studies, etc.
- Sales Qualified Lead (SQL): Those who have shown interest in your product or service by requesting a live demonstration.
- Deal: Real sales opportunities, where their company and yours appear to be a great match.
- Customer: Anyone with an active closed won deal.
- Evangelist: Strong advocates of your business who mention your business in conversations and content.
When defining your lifecycle stages, make sure they’re documented, known by all stakeholders and consistent. Once you have your lifecycle stages defined, you can then measure how many leads of each type you have and the conversion rates associated with them.
2. Source & Cost Attribution
Ideally your analytics and CRM are set up in a way that easily displays where leads come from and when. Source (or channel) attribution and the breakdown (by months) of where the leads were generated is key to understanding campaign performance from various sources. Traffic times conversion rate equals success.
Knowing which channels your leads originated from and how much money was spent in each channel can be represented in something like this (we break up the cost of content creation in thirds across Direct, Referral & Organic, since it affects each):
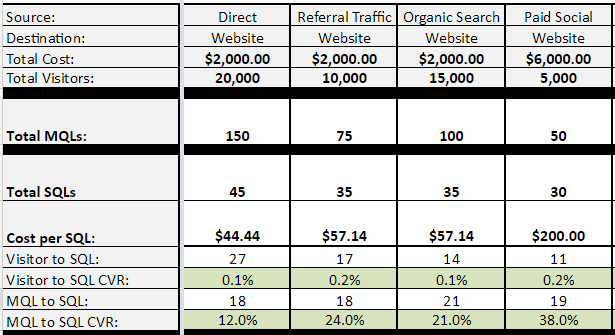
From a cost perspective, it is equally important to match up the dollars spent with the month the leads were generated to measure the cost effectiveness of your lead sources. Each source will have different lead numbers and associated costs to compare. This also enables you to prioritize what to optimize next, support where to double-down and inform what to cut.
3. Goal Ramp Incorporation
Goals are mandatory for any company looking to succeed — so why not tie them into your lead conversion tracking data? This way, everyone involved can easily see what the performance is relative to the goals in place. One example is an SQL goal ramp that increases by 10 percent month over month:
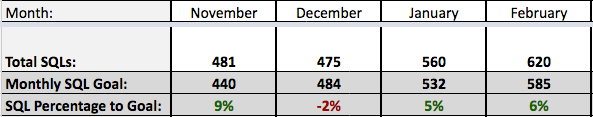
As you can see, February’s total SQLs exceeded the February goal by 35, approximately 6 percent. To implement an “actual number in relation to goal number percentage” like this, use the following formula: (Actual – Goal) / Goal. This is helpful for any goals you have associated with marketing: revenue, other lifecycle stages, etc.
4. Monthly Recurring Revenue per SQL
This is where we start to tie in revenue generated from marketing to help display quality that’s associated with the leads being generated. Just like with content, quality beats quantity.
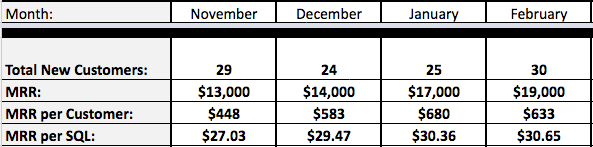
Remember the SQL actuals compared to goal example in #3? We fell short of the goal in the month of December. However, when you look at the monthly recurring revenue (MRR) generated from sales qualified leads that originated in December, you’ll notice it is higher than the previous month, indicating the quality improved. MRR per SQL is just MRR / Total SQLs.
Exceeding lead quantity goals is fine, but not nearly as good as seeing monthly recurring revenue per SQL trending upward for your business.
5. Months to Payback
This one also takes into account the value of new customers generated from leads, and it’s my favorite indicator of marketing performance. Similar to the CLTV/CAC ratio, months to payback directly correlates to how fast your SaaS company can grow.

The calculation is Total Cost / MRR, and you want to see this number trend downward for your business, because it measures the number of months of new MRR generated that month required to “pay back” the dollars spent in marketing that month to generate the leads.
The lower number, the sooner the business is making profit. Anything in the 2 to 3 months range or lower is ideal for accelerated growth, especially if you offer annual deals.
6. Multiple views of the above data
To display all of the above B2B lead conversion tracking metrics, set up a couple sheets in Excel:
- One for all your different sources (referral traffic, organic search, paid social, etc.)
- One monthly/master sheet that your sources data feeds into each month
A weekly sheet is valuable, too. Just keep in mind, the longer you’re tracking lead conversions like this, the longer it takes to update the data each time, since we’re attributing revenue and lifecycle stage advancement to prior months when leads originated.
The last step is sharing the data with all involved stakeholders. Walk them through all the components and the key areas they should watch.
Conclusion
Successful B2B lead conversion tracking takes into account several key factors to measure and communicate marketing performance, but it’s also an effective way to optimize future business goals and campaigns.
What lead conversion tracking methods are you using for your SaaS company in 2017? Comment below to let me know.
About the Author: Ethan DeYoung is the VP of Demand Generation for ClearVoice, a content marketing software and services company with a vetted freelancer marketplace. Connect with him on LinkedIn.
from The Kissmetrics Marketing Blog https://blog.kissmetrics.com/b2b-lead-tracking-methods/
No comments:
Post a Comment