
The following is an excerpt from Do's and Don'ts of Infographic Design, a free guide we created with our friends at leading graphic design software company Venngage. If you'd like to access the full guide, click here.
One of the most important, but least considered parts of designing an infographic is typography. After all, picking the right fonts is exceptionally hard. Besides the fact that there are thousands of options, finding the “right” font is actually really subjective. Different designers have different fonts tastes, and any designer could any number of fonts in their designs.
Getting good at choosing the fonts for your designs is difficult, but here are a few guidelines to get you started.
The Do's and Don'ts of Infographic Typography
DO: Stick to the primary categories of font families.
If you don’t know much about typography, here’s the biggest thing you need to know: there are three main categories of font families: serifs, sans serifs, and display fonts. Each has different purposes and common uses among designers.
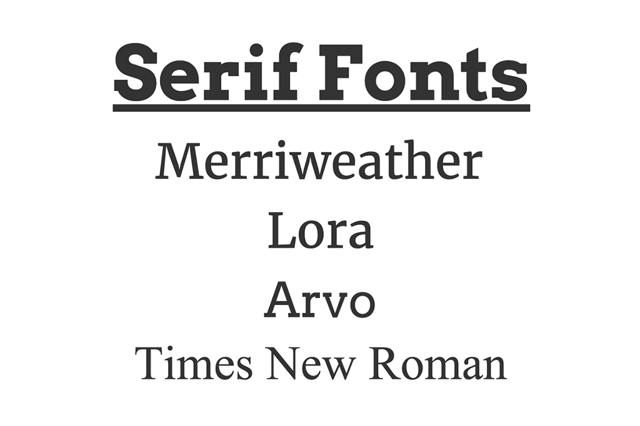
Serif fonts are fonts that have small lines or embellishments attached to the letters. These embellishments are called “serifs.” Common fonts such as Times New Roman and Merriweather are examples of serifs.
How are they used? One common argument is that serif fonts should be used as body text because it’s easier to read them in large blocks of text. However, this preference mostly stems from historical precedence: we’re used to reading Times New Roman in books and white papers, therefore there is the precedence that the font type is generally “easier to read” in large bodies of text. When you’re first starting out, it’s a good idea to keep this use in mind.
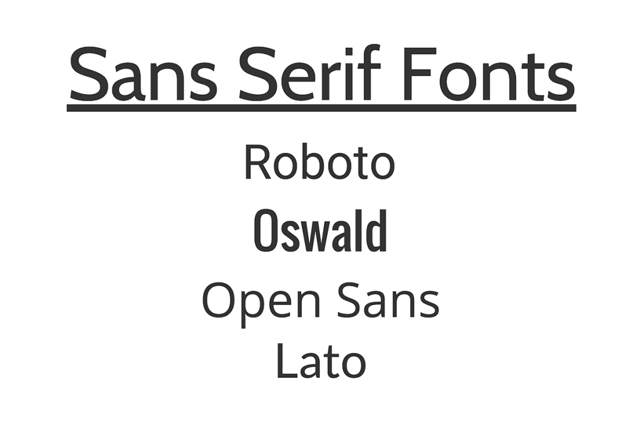
Sans serifs are fonts that do not have small lines or embellishments attached to the ends of letters. Some of the most popular fonts in this family include Roboto, Helvetica, and Arial.
How are they used? While serif fonts are considered to be best for body text, sans serif fonts are considered to be better for section headers, captions, lists and titles in your infographic. Still, many designers on the web tend to use them for body text as well, so it’s mostly a matter of preference and trend.
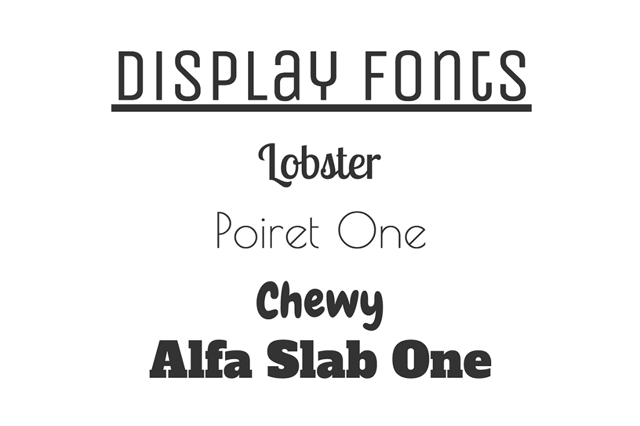
Display font families are fonts that are more playful by design. The might be cursive or handwriting fonts or just funky fonts meant for specific types of design.
How are they used? Generally speaking, most designers agree that you should really only use display fonts as headers to set the mood and theme of your design. Typically, display fonts are used as a focal point in a design so that it draws the reader's eye to one spot. Some popular display fonts include Lobster, Alfa Slab One, and Unica One (see below).
When it comes to choosing fonts, there are millions of options. That said, experienced designers tend to have strong preferences for which fonts to use and which fonts not to use. If you’re not sure where to begin, try using a tool like Font Pair to get designer-recommended font groupings.
DO: Match the theme of the infographic.
The first step to picking fonts is to think about the theme or topic of your infographic. Are you trying to convey a playful or serious tone? Humorous or dark?
Then think about the audience and intent of your infographic. If the goal of your infographic is to share data, you probably want to make the infographic look more professional than cartoonish. Alternatively, if your infographic is meant for kids, it might be more appropriate to use cartoonish display fonts.
Sometimes, it helps to take a look at other infographics to grasp how you should think about thematic design.
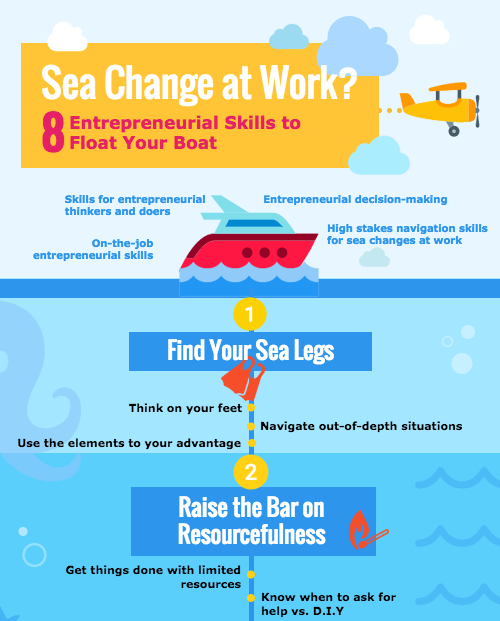
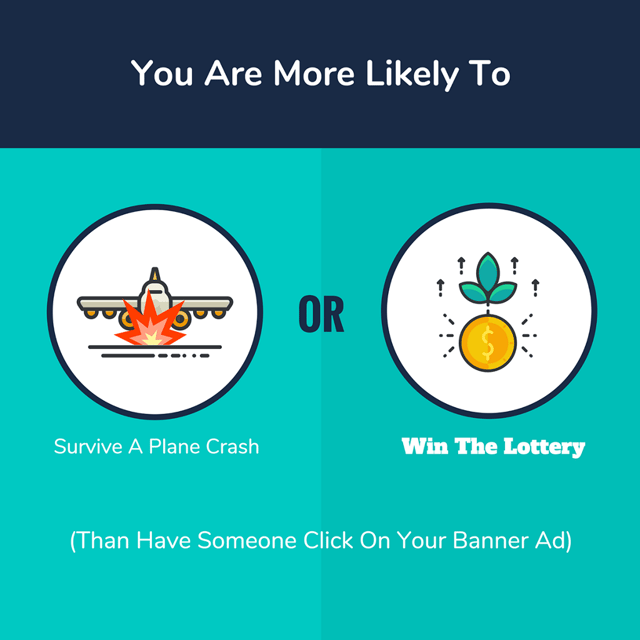
In the example below, the author decided to use sans serif fonts throughout. The result is a very minimalist and futuristic design that correlates well with the topic: online learning.

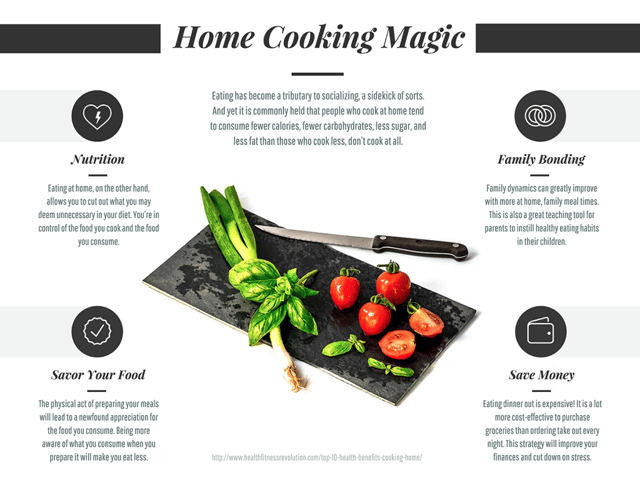
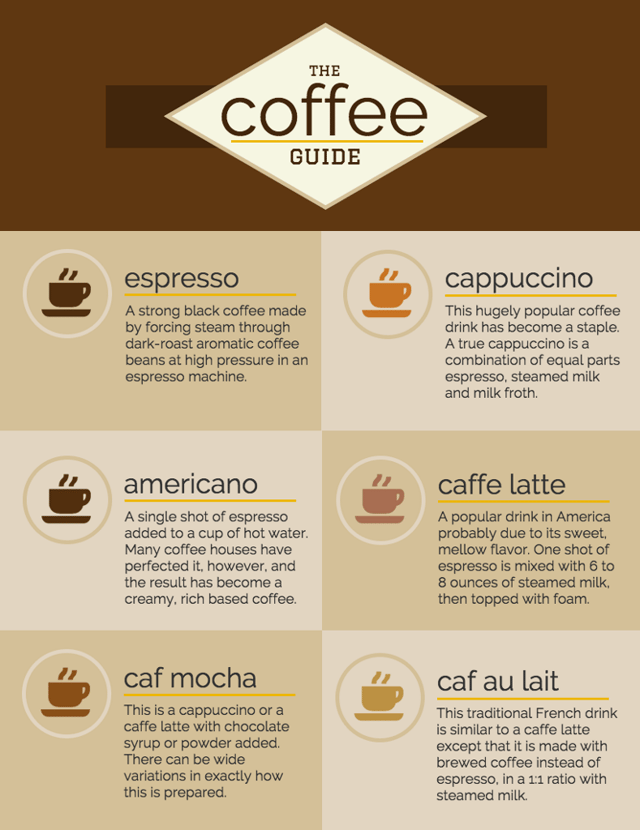
In contrast, the creator of the next infographic used a mix of serif fonts and sans serif fonts, creating a very sleek, classic look that pairs well with the topic of cooking.
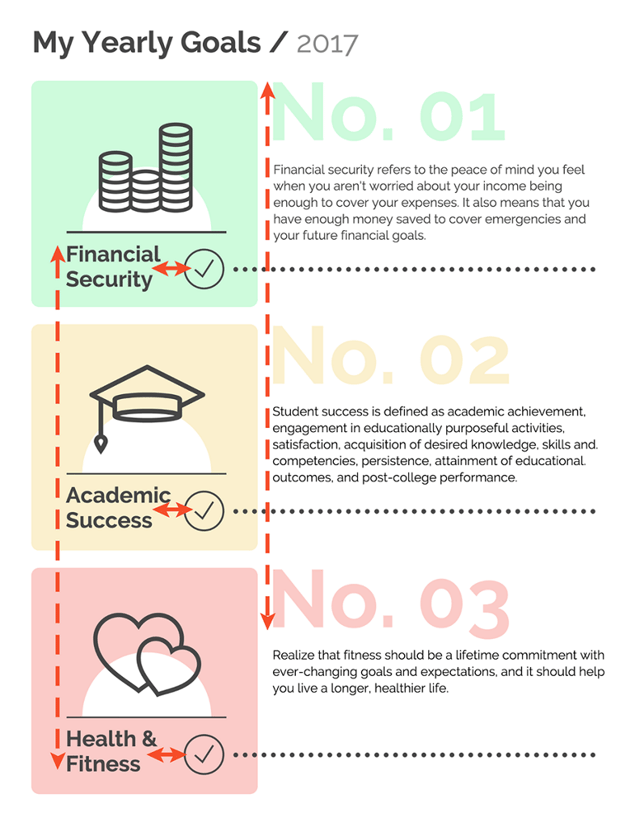
The next infographic showcases a different serif font. Through the use of bright colors and easy-to-read fonts, the infographic feels very whimsical. Could the author have used a different font family in it? Of course! The point is the font that was chosen subjectively, by the designer, to fit the theme they were aiming for.
There’s no right answer when it comes to picking fonts for your infographic. Instead, try to think about typography as a complementary element of your whole theme. Choose with purpose, not just because you like a font you see in a list somewhere.
DO: Pick a font palette & stick to it.
It’s not enough to just pick a few fonts and use them however you want. To make a well-designed infographic, it’s important to establish for yourself what sizes, weights, and fonts you're using throughout different sections. In other words, creating a font palette will keep your design consistent and improve the overall look of your infographic. Just like choosing a color palette, you need to find fonts that work together and then assign them to different parts of your infographic.
No idea where to start? Here a few tools to help:
Google Font tool: Made up of about 800 different font choices and shows you what particular fonts will pair well together.
For example:
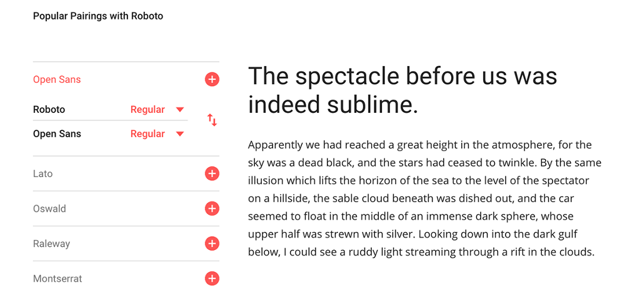
Font Pair: This blog makes finding fonts that go well together (by font category) easy by showing you examples in action on a simple browser.
Once you have a few font options in mind, you can start creating your font palette. In general, most infographics will have about five parts to a palette.
Note: this does not mean you need five different fonts. Here’s an example of how a font palette might be broken up based on the organization of your infographic:
- Main Title
- Section Title
- Headers
- Descriptors
- Body Text
In general, you shouldn’t be using more than 2-3 different font families. Instead, use different weights and colors for different sections, but keep the fonts consistent.
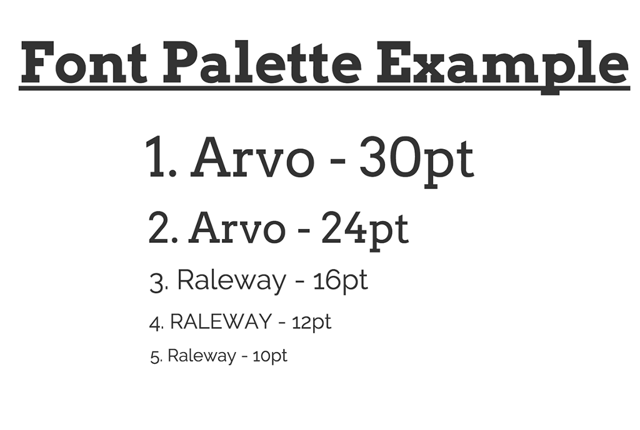
In this next example, the font palette uses two different fonts with different weights and cases to create five unique parts of the palette:

Here is an example of font palette you could use to create your own hierarchy.
DO: Match fonts with icons.
Picking icons to use with your headers and fonts can be another area of difficulty for first-time designers.
When it comes to icons and fonts, great pairings can be achieved just by keeping the style consistent throughout.
For example, take a look at the infographics below:
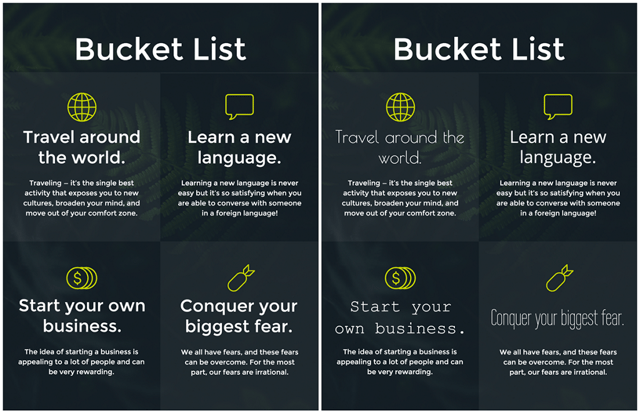
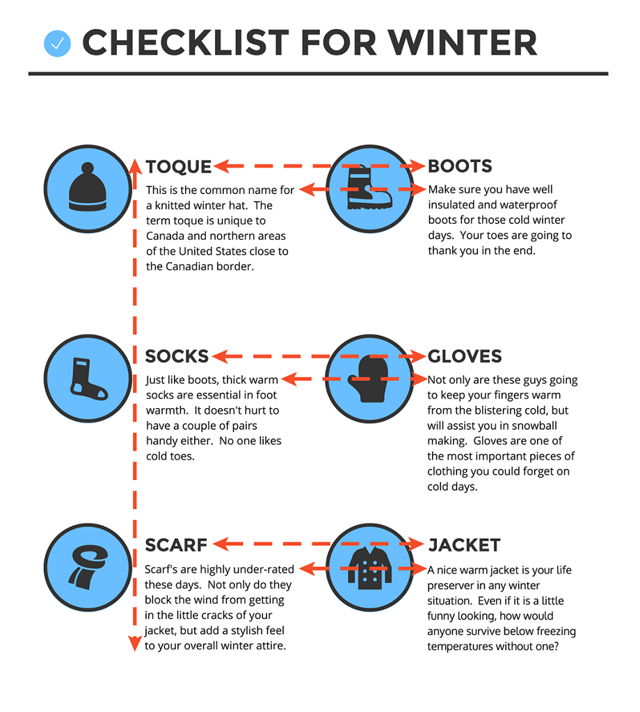
The infographic on the left conveys a certain feel of professionalism because the strong title font contrasts with the minimalism of the icons. Additionally, all of the fonts match each other, which helps to create an organized structure. The example on the right, on the other hand, uses four different fonts that don’t have the same level of contrast with the icons.
Here’s a good rule of thumb: if your icons are minimalist, light, and thin, trying using strong fonts in contrast.
Alternatively, if you’re using bolder, fuller icons, use a minimal font in contrast. Here’s an example demonstrating that effect:
In the next example, the font icon on the left has good contrast because the icon is meant to stand out. The version on the right, however, doesn’t have the same level of contrast, making the focal point harder to navigate.
DO: Align everything.
Design alignment refers to how you place similar elements in proximity to one another. Poor element alignment makes for a poorly-designed infographic and can be distracting to the viewer.
Alignment is a part of placing every single graphic, text, header, and element on your infographic. When you’re in the design process, have a mental checklist:
- Are all of my headers aligned in the same vertical axis (left, right, center)?
- Is there the same amount of space between my headers and body text elements?
- Is there the same amount of space between my sections?
- Do my lines end and begin in the same proximity to the elements they’re placed next to?
Here is an example of how elements should be lined up for consistency and elegance:
Make sure to place the same types of elements -- body text, headers, graphics, etc. aligned in the same position relative to the other object within and outside of its section. If you have three sections with a header and body text, each header should be aligned with the other headers, and the same is true for the body text. In addition, there should be equal amount of space between the three different sections.
Here’s an example of an infographic with perfect alignment:
The reader can quickly flow from one piece of information to the other without alignment distraction.
Want to learn what not to do? Click here to access the complete guide: The Do's and Don'ts of Infographic Design.

from HubSpot Marketing Blog https://blog.hubspot.com/marketing/infographic-design
No comments:
Post a Comment